This topic contains a solution. Click here to go to the answer
|
|
|

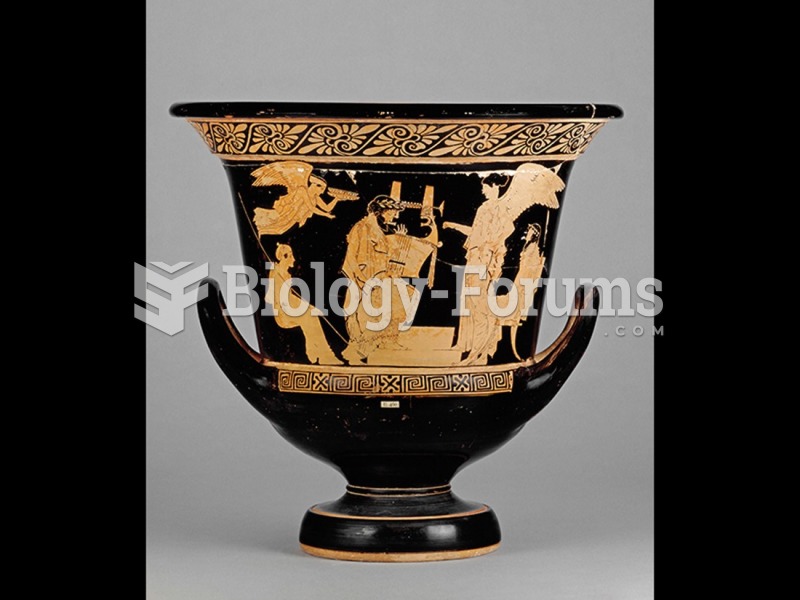 Attributed to the Manner of Peleus Painter, Red-figure calyx-krater.
 How to create a price index to calculate inflation for a basket of goods
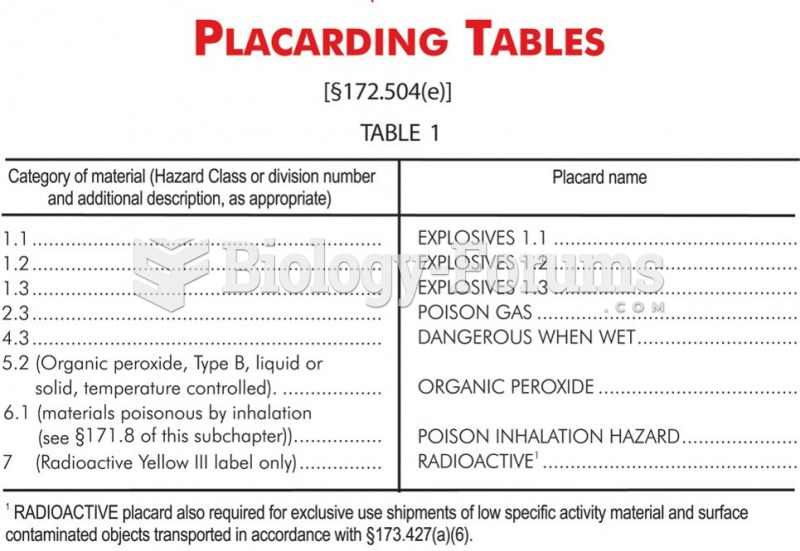 DOT placarding requirements: Table 1 materials must be placarded in any quantity, and Table 2 ...
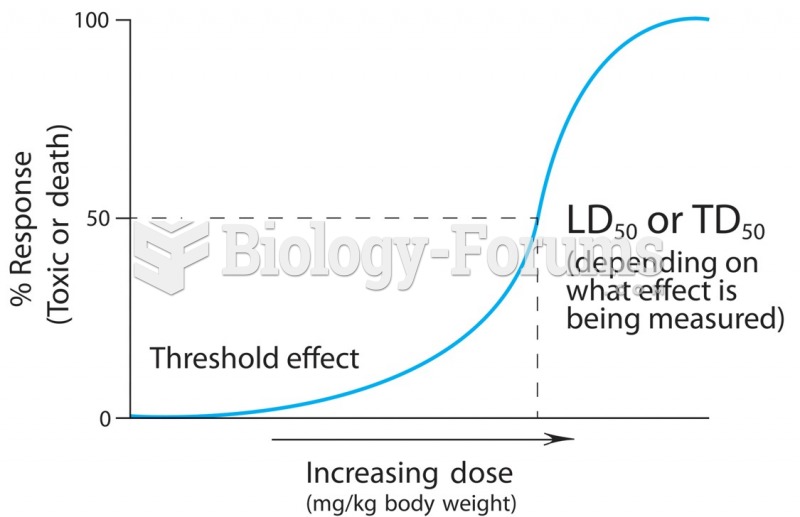 A dose-response curve describes the relationship between the quantity of the chemical entering the ...
 Colossal Figure of Akhenaten
 Swimming Pool (Figure 3.1)