This topic contains a solution. Click here to go to the answer
|
|
|

 The deer mouse and the African elephant represent extremes among mammals of r versus K selection.
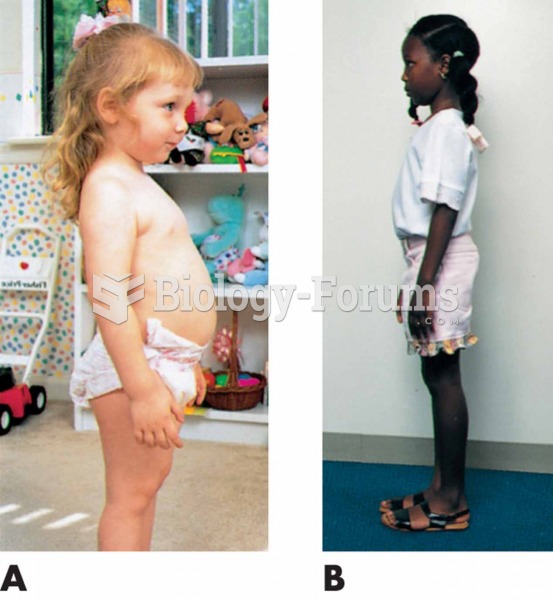 Normal development of posture and spinal curves. (A) Toddler: Protruding abdomen; lumbar lordosis. (
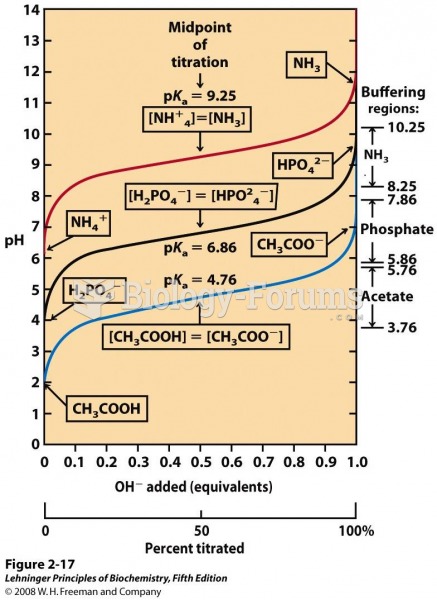 Comparison of the titration curves of three weak acids
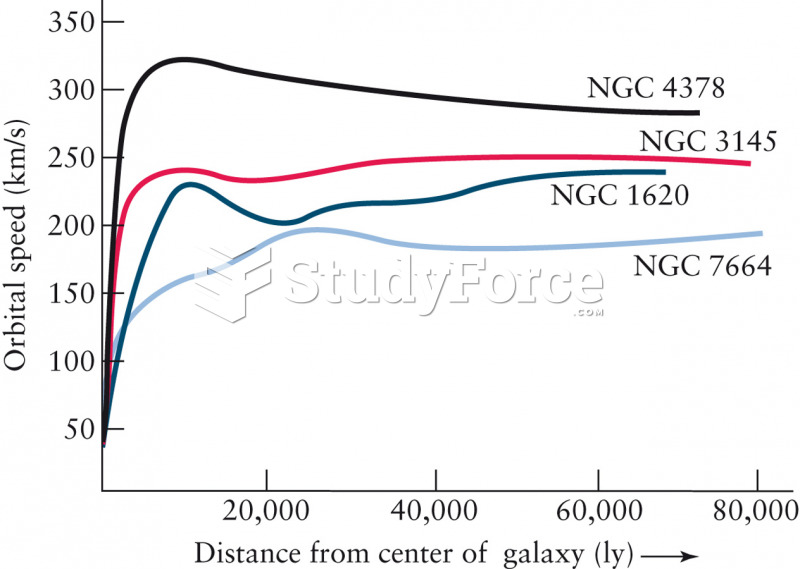 The Rotation Curves of Four Spiral Galaxies
 This graphic illustrates the original systems model of politics advanced by David Easton. Politics
 The ability to roll the tongue is one of several traits that represent the dominant allele.