This topic contains a solution. Click here to go to the answer
|
|
|

 True-color image of layers of haze in Titan's atmosphere.
 Asteroid 1994 XM1
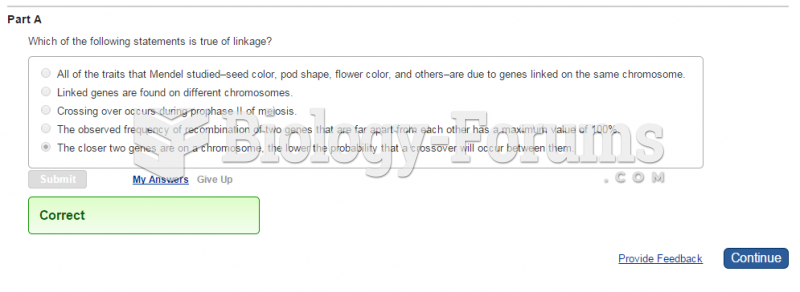 Which of the following statements is true of linkage?
 Demographic Data for India
 Demographic Data for Nigeria
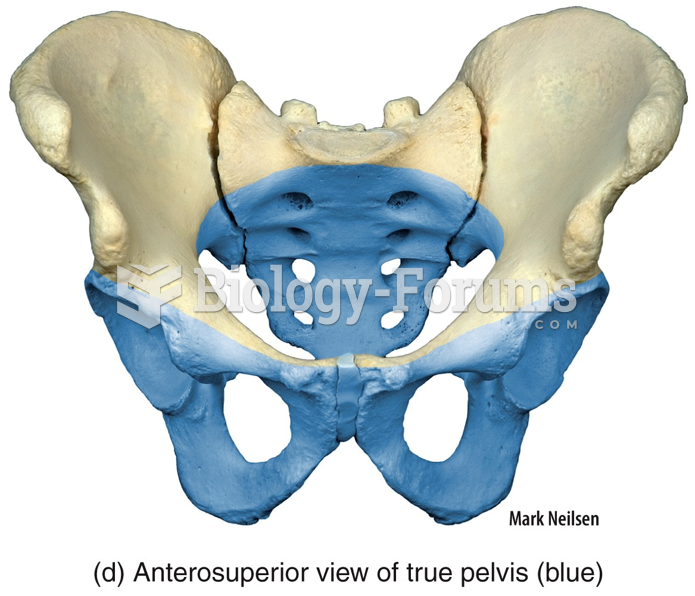 Anterosuperior view of true pelvis (blue)