Answer to Question 1
Grade equivalent scores interpret test performance in terms of grade levels. For example, a fourth-grade student who receives a grade equivalent score of 6.1 on a standardized math achievement test scored as well, on that fourth-grade math test, as a sixth-grade student from the standardization group did in their first month of the school year. The problem associated with the interpretation of this score lies in the improper conclusion that the fourth-grade student is capable of doing sixth-grade work. The interpretation of this score applies only to this particular fourth-grade math test, and had no bearing on the knowledge and skills achieved by a student who is in their first month of sixth grade.
Percentile ranks interpret test performance relative to the performance of a particular norm group. They indicate the percentage of scores at or below a given score point. For example, if a student receives a percentile rank of 95, that means that the student scored as well as or better than 95 percent of the students in the norm group who took this test. The problem associated with interpreting this type of score arises from the misconception that this score indicates percentage correct. The score describes the position of a score in a distribution of scores and gives no information regarding the mastery of objectives. Given the fact that, in large groups, scores cluster at the center of a distribution, an average performance will have a percentile rank of approximately 50 . This is disturbing to most parents who interpret a score of 50 as a failed performance. Also, owing to this clustering of scores, there are fewer differences in achievement between students whose scores are in the middle of the distribution compared with those students whose scores are at the extremes of the distribution.
Standard scores are expressed in terms of a common unit, the standard deviation. A standard deviation indicates the degree of deviation of scores from the mean of a distribution of scores. The mean is the arithmetic average of the distribution. The distribution of standard scores exists on the normal curve, which is a hypothetical, symmetrical, bell-shaped distribution whose center is the mean of the distribution. A normal probability curve is illustrated on page 499 . Two types of standard scores may be reported. One, called a z score, tells how far a given raw score is from the mean in standard deviation units. For example, a z score of +2 indicates that the raw score is located two standard deviation units above the mean. Unfortunately, z scores can take on negative and decimal values that are difficult for parents to understand. A z score of 1 is commonly misunderstood to indicate a poor performance when, in fact, it indicates an average performance. To avoid these difficulties in communication, schools often report T scores. T scores are also based on the normal curve. However, the T score distribution ranges from 0 to 100, having a preselected mean of 50 and a standard deviation of 10 . A z score of 1 is equivalent to a T score of 40, which is easier to explain to parents. The relationship among z scores, T scores, and percentile ranks is illustrated on page 342.
Stanine scores indicate student performance with reference to a standard nine-point scale based on a normal curve. This type of score divides the population of scores into nine groups. Each stanine is equivalent to one-half of a standard deviation unit. A stanine score of 1 indicates a low performance, 5 indicates an average performance, and 9 indicates a high performance. Stanines are easier to communicate to parents than either z or T scores. Stanines are illustrated on page 500 . The controversy associated with stanine scores relates to their being used by some schools to group students according to ability (Chapter 6).
Answer to Question 2
The sensory register serves to hold selected stimuli for possible further processing into short-term memory. It is the first memory store whose duration is from one to three seconds, just long enough for one to decide whether to attend to the stimulus perceived.

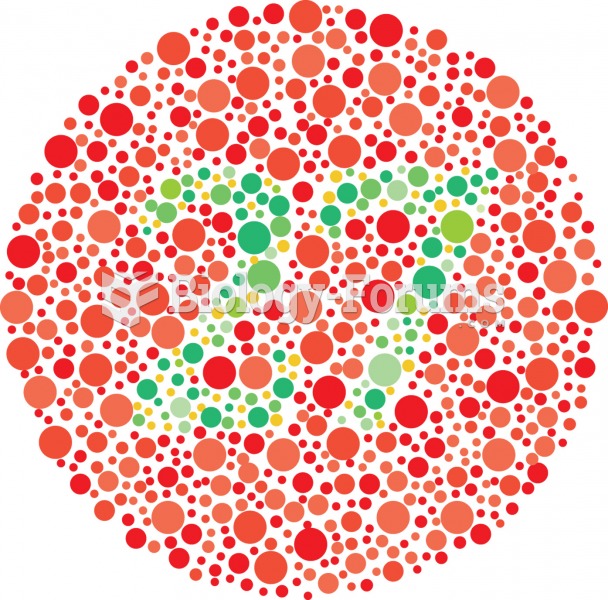 An example of color blindness test. A person with red-green color blindness would not be able to dis
 Types of fungi and a fungal infection of the palate.
 Types of supercoiling found in chromosomes
 High stress, by household type (age-standardized), age 18+, Canada, 1994-1995
 Discuss the trend you notice about enbridge inc
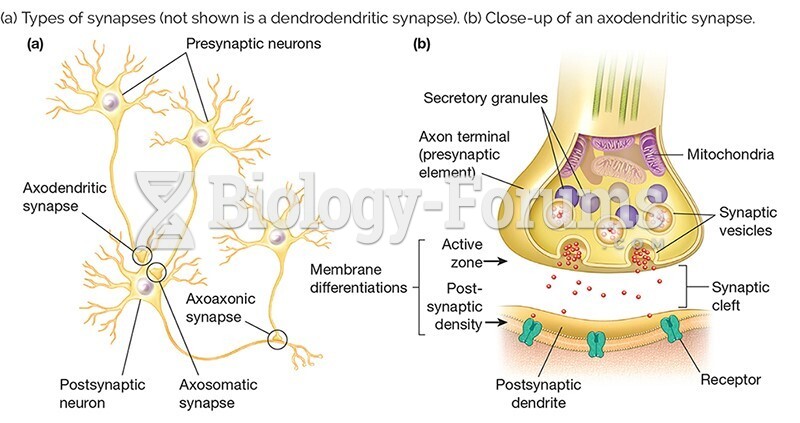 Types of Synapses