Answer to Question 1
True
Answer to Question 2
1. See Solution Exhibit 10- 23. There is a positive relationship between the number of service reports (a cost driver) and the customer-service department costs. This relationship is economically plausible.
2. Number of Customer-Service
Service Reports Department Costs
Highest observation of cost driver 455 21,500
Lowest observation of cost driver 115 13,000
Difference 340 8,500
Customer-service department costs = a + b (number of service reports)
Slope coefficient (b) = = 25 per service report
Constant (a) = 21,500 (25 455) = 10,125
= 13,000 (25 115) = 10,125
3. Other possible cost drivers of customer-service department costs are:
a. Number of products replaced with a new product (and the dollar value of the new products charged to the customer-service department).
b. Number of products repaired and the time and cost of repairs.
EXHIBIT 10- 23
Plot of Number of Service Reports versus Customer-Service Dept. Costs for Capitol Products

 Preparing Slides
 Performance of a delayed nonmatching-to-sample trial.
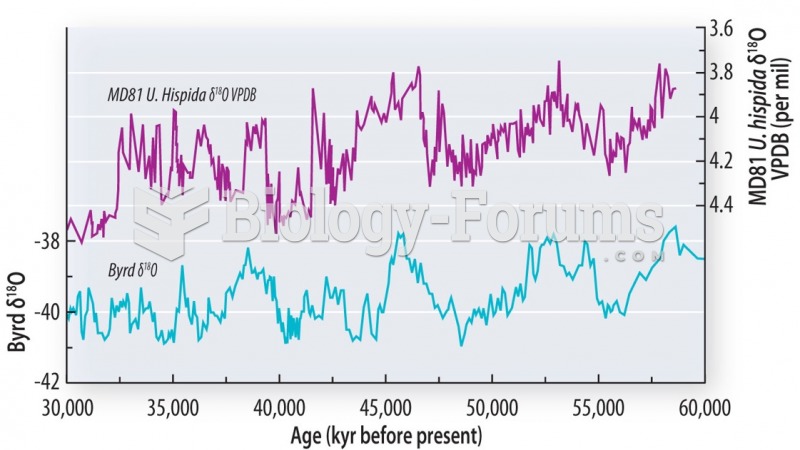 The isotope record
 Preparing Canapés ( 1 of 5)
 Acid–Base Balance
 In order to encourage Canadians to avoid cross border shopping, Walmart Canada is striving to ...