This topic contains a solution. Click here to go to the answer
|
|
|

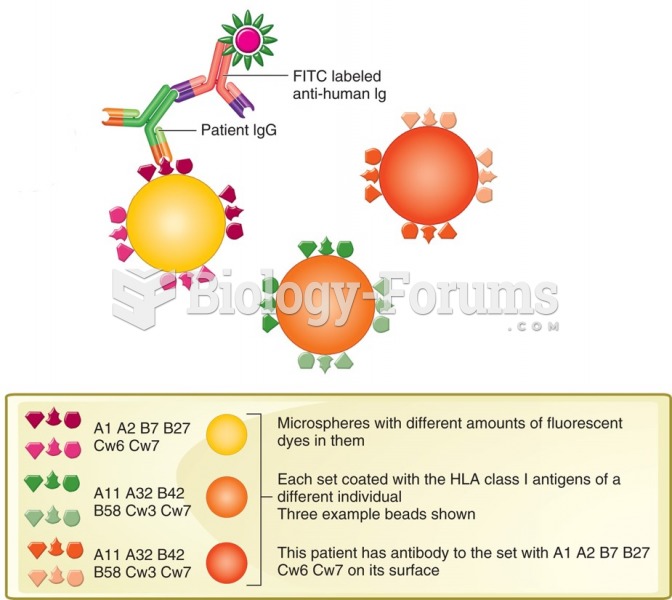 Colorimetric multiplex assay to determine anti-HLA antibodies in a patient's serum.
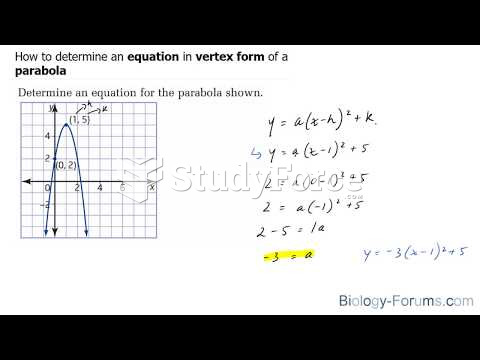 How to determine an equation in vertex form of a parabola
 How to determine if a function is even or odd
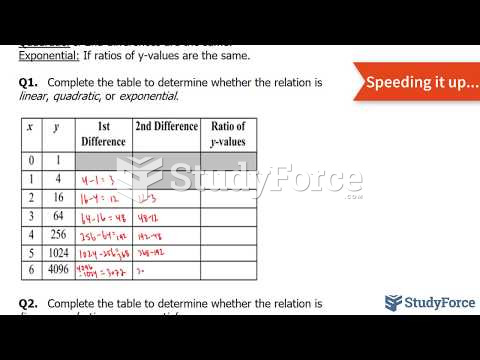 How to determine an exponential relation from a table of values
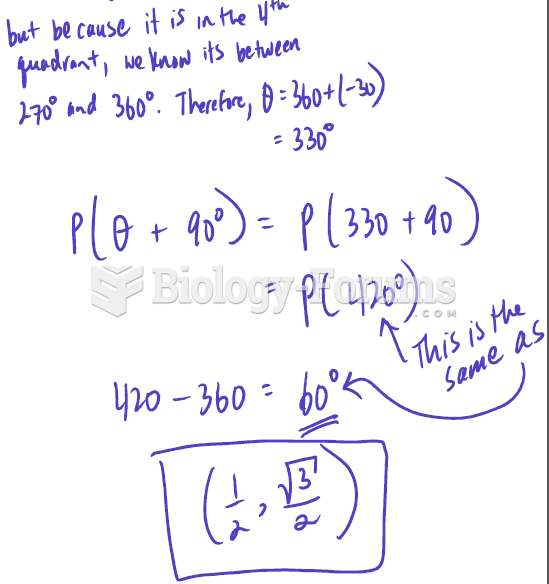 If P(θ) = (√3 /2, -1/ 2), determine the coordinates of P (θ + 90 °) using the unit circle
 Table - Correlation Analysis