This topic contains a solution. Click here to go to the answer
|
|
|

 Genetic engineering as an application for cures
 Demonstrate the Application of Triangular, Figure-Eight, and Tubular Bandages
 Stereotypes, which play such a profound role in social life, are a basic area of sociological ...
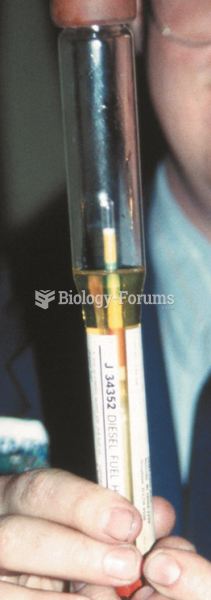 A hydrometer is used to measure the American Petroleum Institute (API) specific gravity of diesel ...
 Social Conditions and Gender
 Gender Representation in Children’s Film