This topic contains a solution. Click here to go to the answer
|
|
|

 This image shows an artists depiction of a 10-kilometer (six-mile) diameter astero
 Increasing access to care for teen mothers is important because they have a higher rate of pregnancy ...
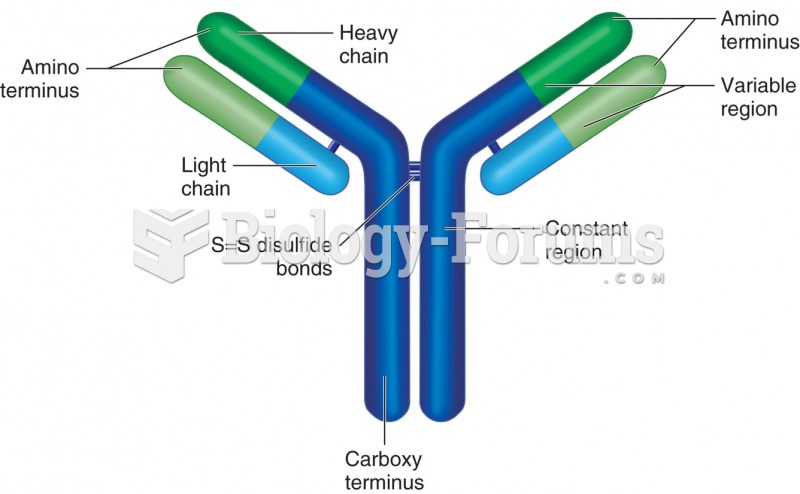 Schematic of an IgG molecule: Two heavy and 2 light chains are linked together by disulfide bonds. ...
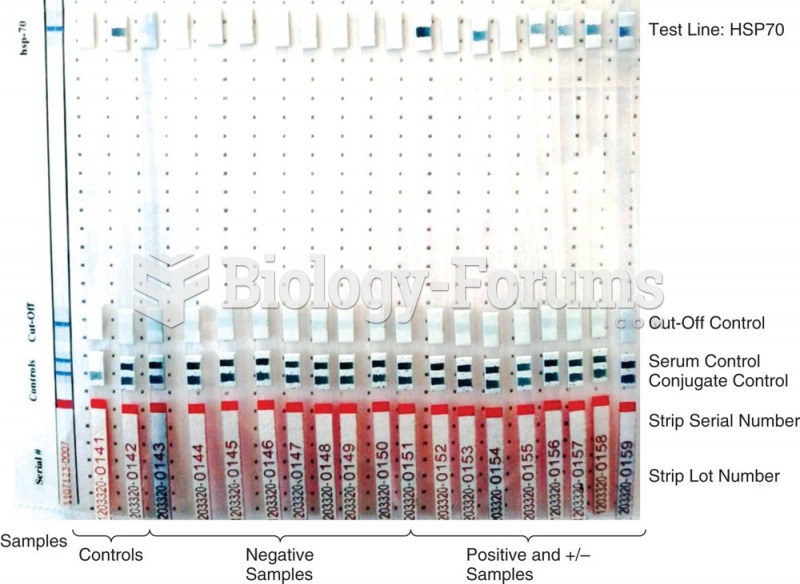 Line immunoassay (LIA), also recombinant immunoblot assay (RIBA) and Immuno-stripe, is similar to a ...
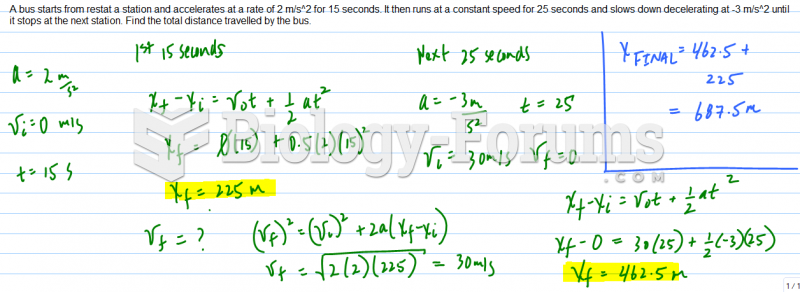 A bus starts from restat a station and accelerates at a rate of 2 m/s^2 for 15 seconds. It then runs
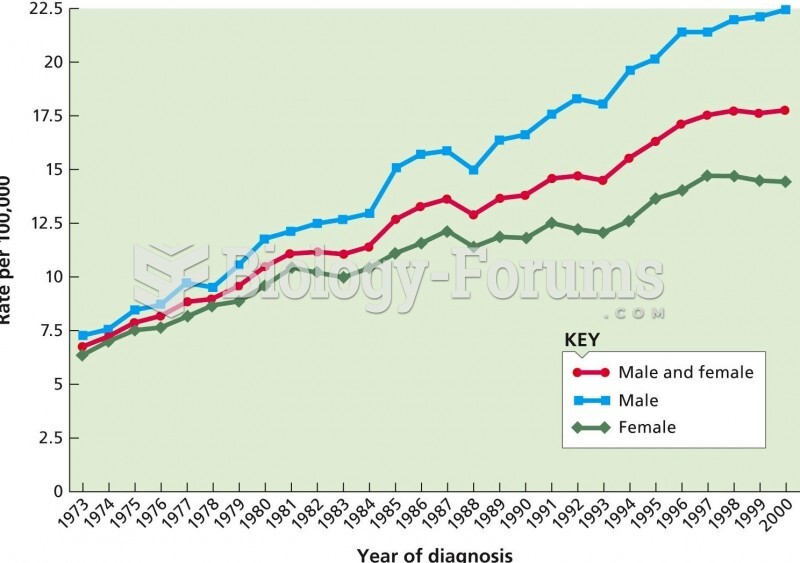 The age-adjusted rate of melanoma, a deadly form of skin cancer, from 1973 to 2000. Over that time p