This topic contains a solution. Click here to go to the answer
|
|
|

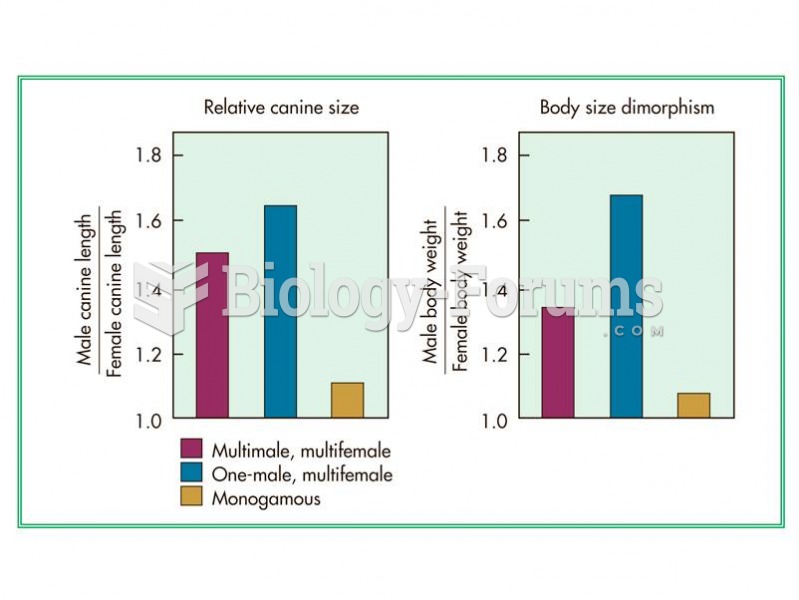 The most polygynous primates live in groups with many more females than males.
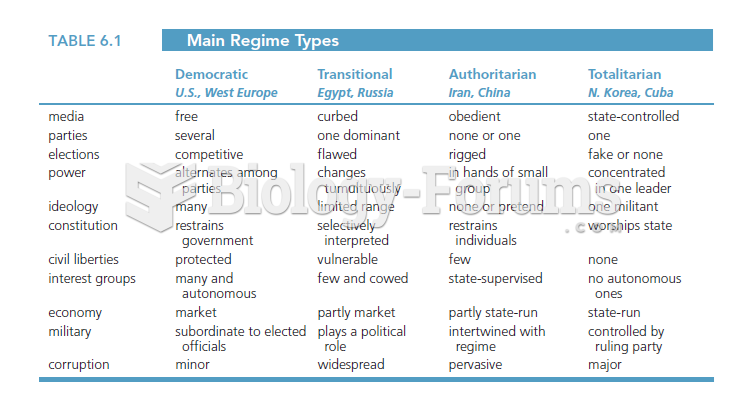 Table 6.1 illustrates the main regime types and their differences. It breaks the regimes into four
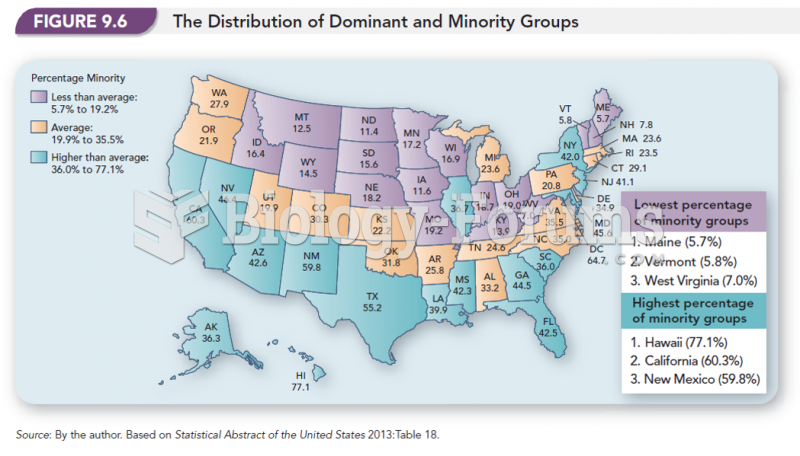 The Distribution of Dominant and Minority Groups
 Disitive Time For Potatoes
 Grand Funk Railroad - Bad Time
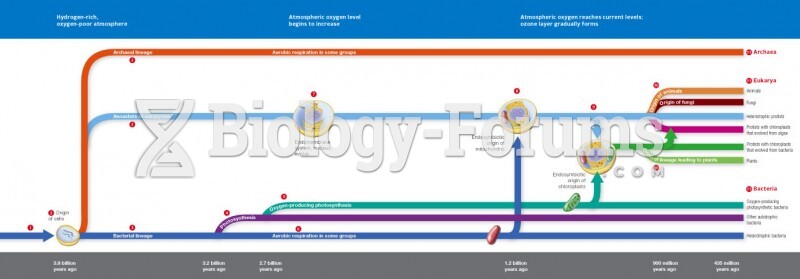 Time Line for Life’s Origin and Evolution