This topic contains a solution. Click here to go to the answer
|
|
|

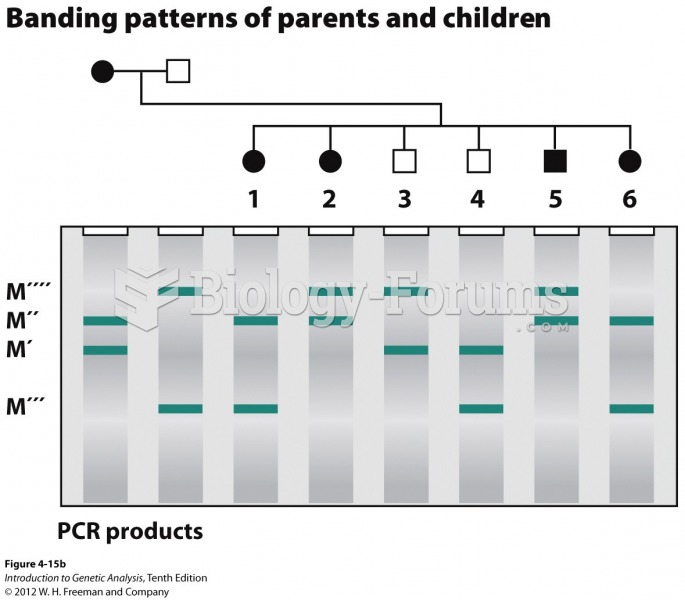 A microsatellite locus can show linkage to a disease gene
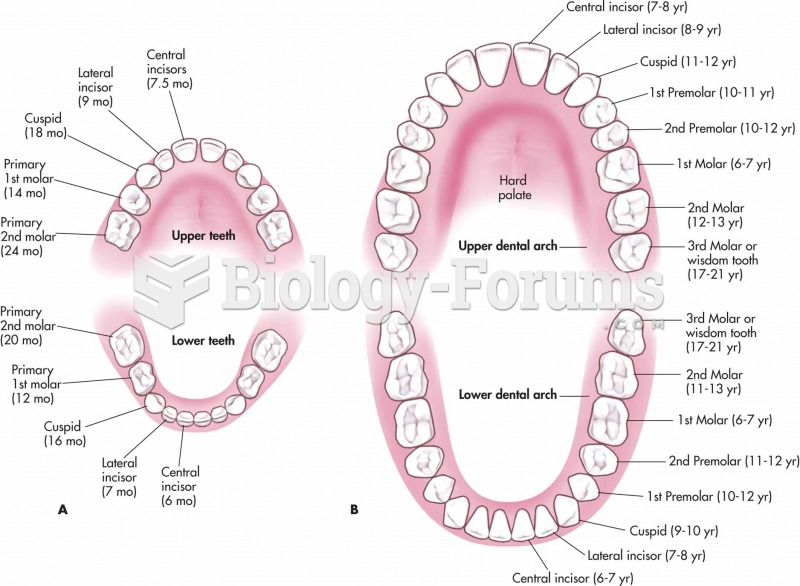 Deciduous and permanent teeth. (A) The deciduous teeth, with the age of eruption given in months; (B
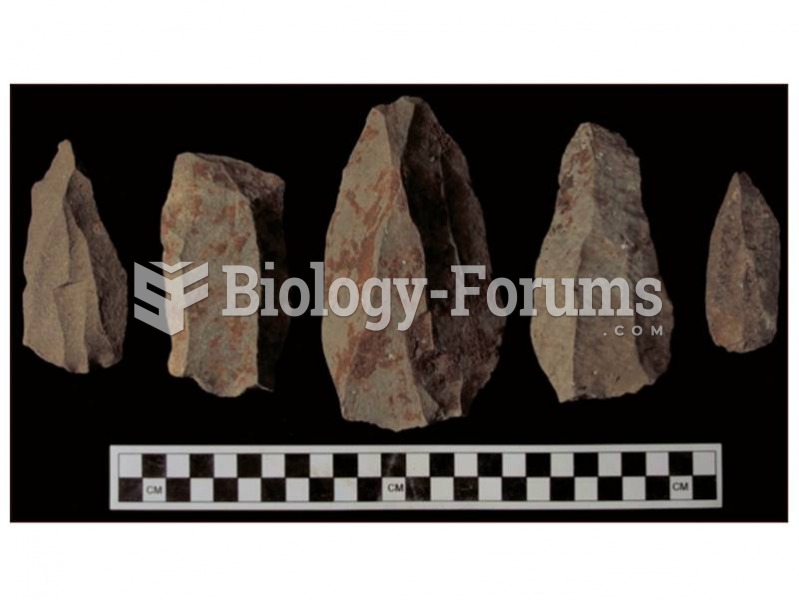 Levallois points and flakes from Kapthurin, Kenya date to between 200,000 and 280,000 years ago.
 Some drug labels show the USP symbol; others do not.
 A sidewheeler on the Mississippi. In 1856 Samuel Clemens became an apprentice to a steamboat pilot a
 An antique painting is purchased in 1980 for $995. The value increases by 3.1% e