After examining the graph depicting total MSW generation and per capita generation, the main conclusion one can make is ________.
A) humans are not recycling as much as they did previously
B) recycling of e-waste is having an effect
C) personal reuse and recycling efforts are having an effect
D) MSW generation continues to grow exponentially
E) per capita generation continues to grow exponentially
Question 2
Which biome has the greatest biological diversity?
A) tropical rain forest
B) oceans
C) temperate deciduous forest
D) deserts
E) grassland

 Photomicro graph showing the three layers of the skin.
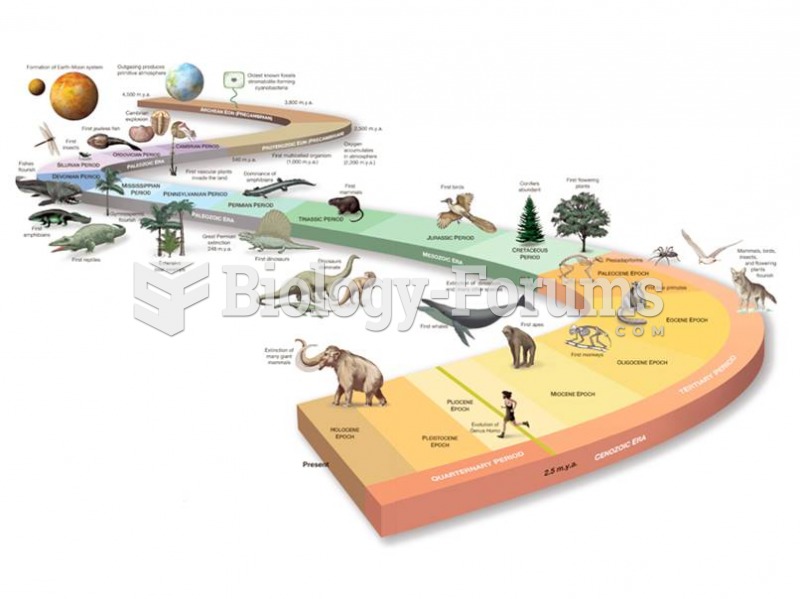 Earth’s history spans 4.5 billion years. Geologists and paleontologists have pieced together the his
 Generally, the total tax burden in the United States is much lower than that of other industrialize
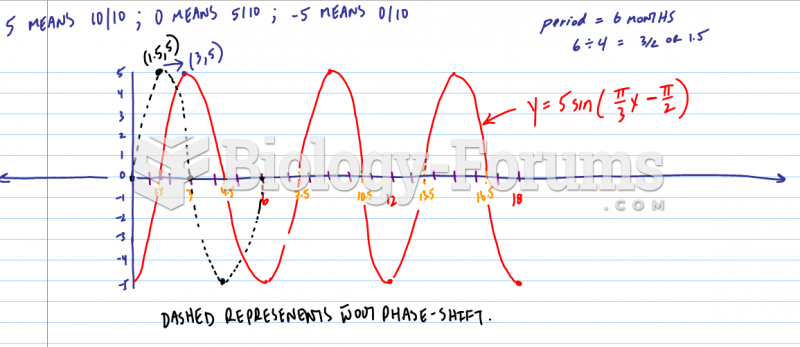 Sketch a graph of the function h(x), by hand on the following interval:
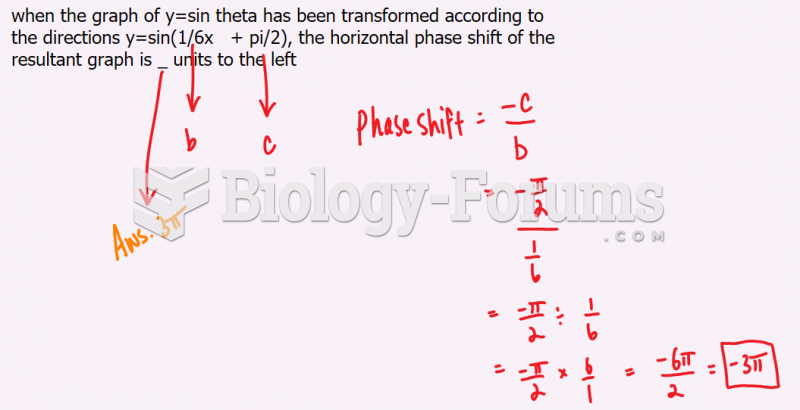 The horizontal phase shift of the resultant graph is
 Finding the graph of a Parabola using certain values