This topic contains a solution. Click here to go to the answer
|
|
|

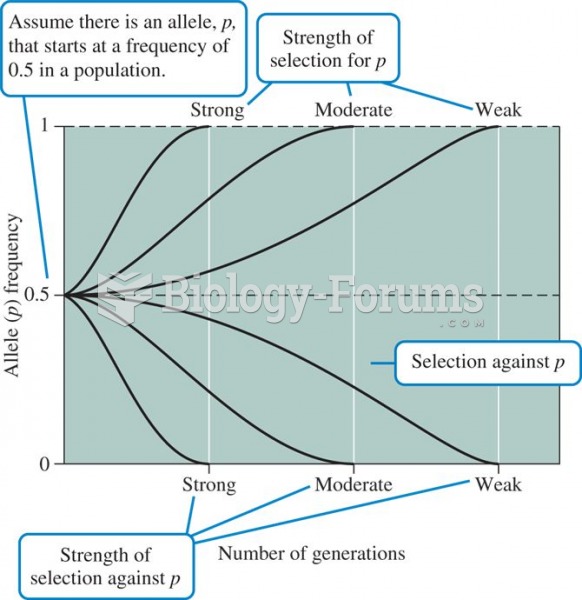 Variation in the rate of evolution as a function of the strength of selection, assuming genetic drif
 This image shows an artists depiction of a 10-kilometer (six-mile) diameter astero
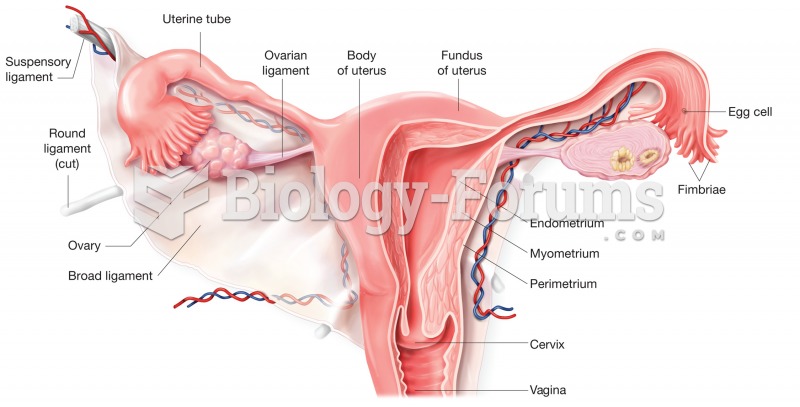 The uterus. Cutaway view shows regions of the uterus and cervix and its relationship to the uterine
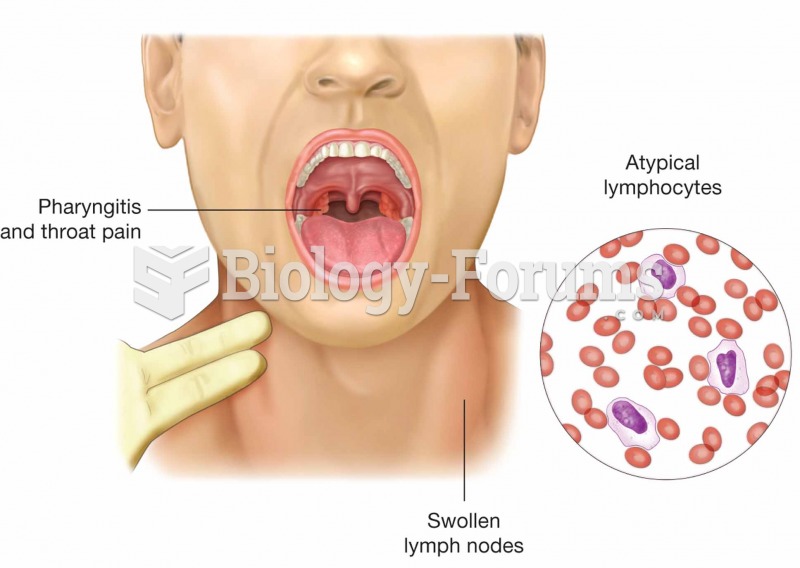 Mononucleosis is caused by the Epstein–Barr virus. Symptoms of the infectious disease are swollen pa
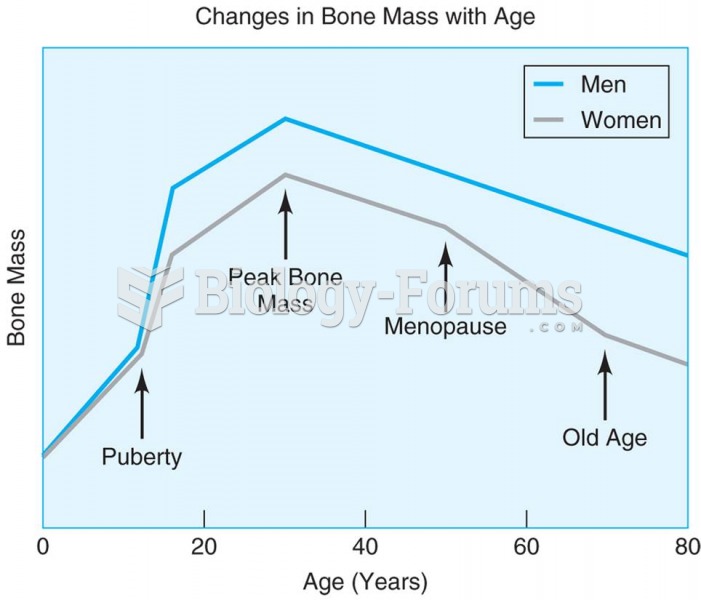 The greatest bone mass is found around age 30 for both men and women, with the later decline being f
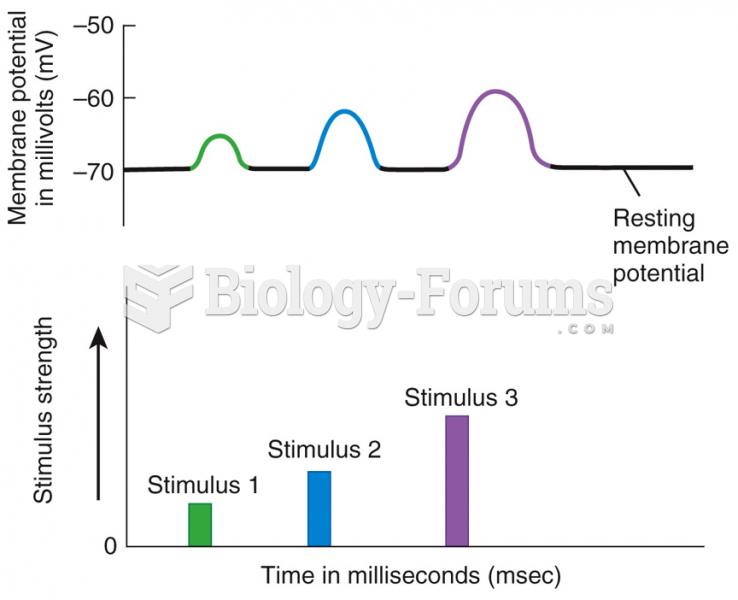 Graded Potentials: Stimulus Strength