This topic contains a solution. Click here to go to the answer
|
|
|

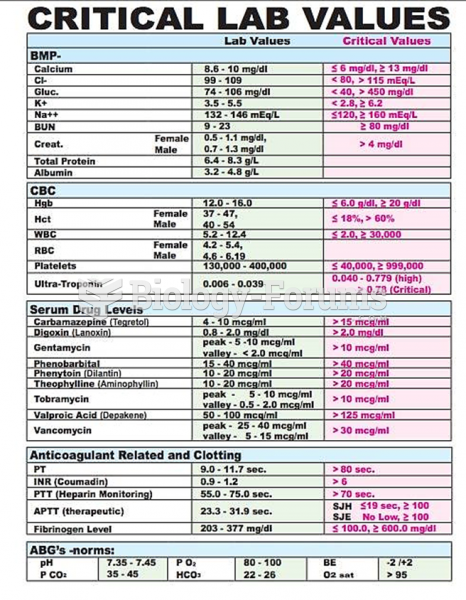 Lab Values
 How to find the quartiles and percentiles for a data set
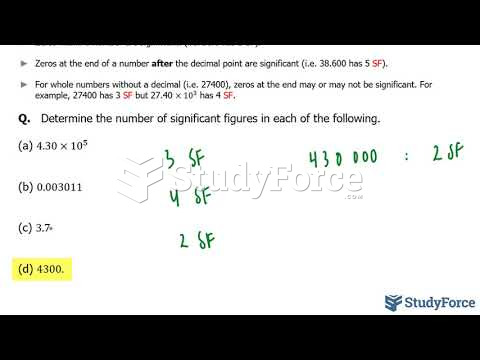 How to count for the correct number of significant digits
 How to setup and solve a half-life problem using a table of values (Question 1)
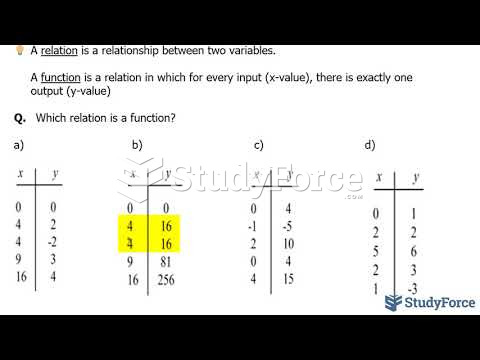 How to determine if a table of values represents a function
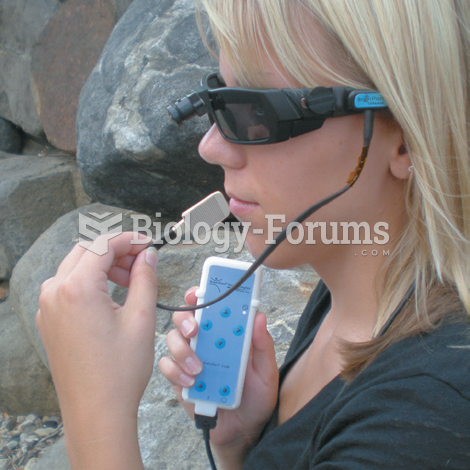 Sensory Crossover Device for Visually Impaired People