This topic contains a solution. Click here to go to the answer
|
|
|

 Calcium Antagonist
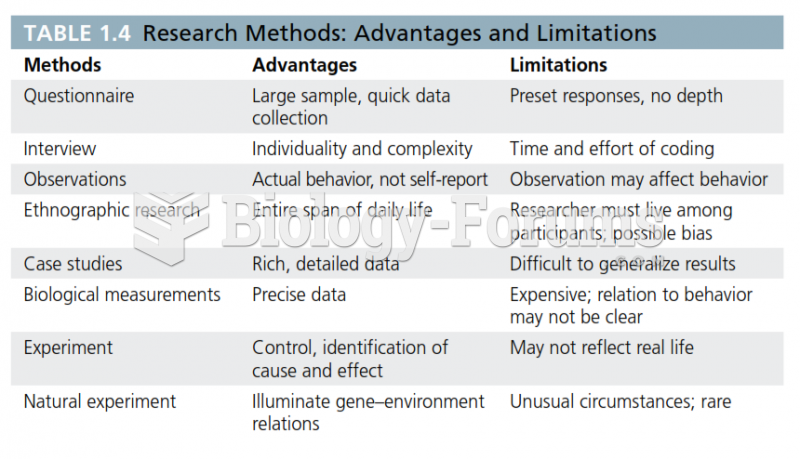 Research Methods: Advantages and Limitations
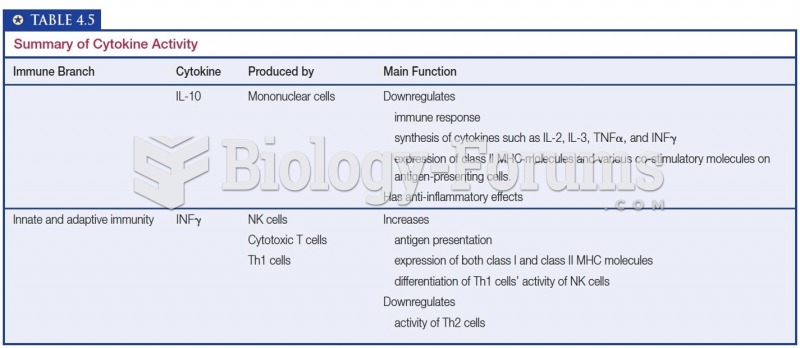 Summary of Cytokine Activity
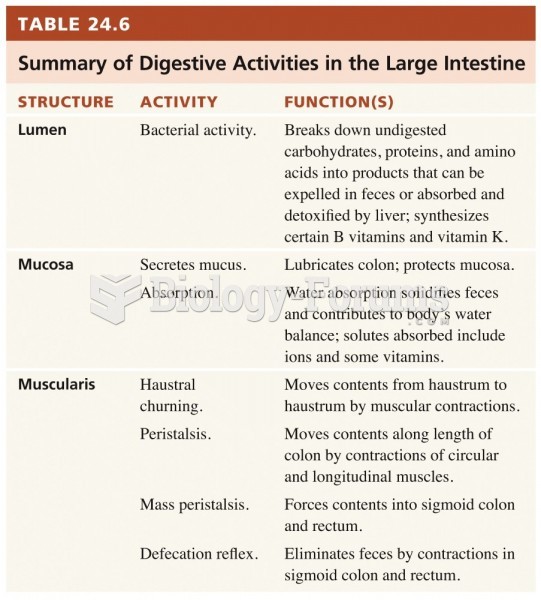 Summary of the digestive activities
 Summary of Structures of the Ear
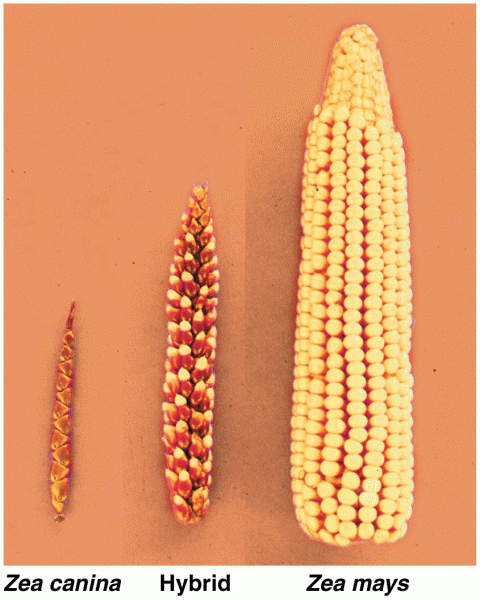 Selective breeding is one of the oldest methods of genetic alteration of plants