This topic contains a solution. Click here to go to the answer
|
|
|

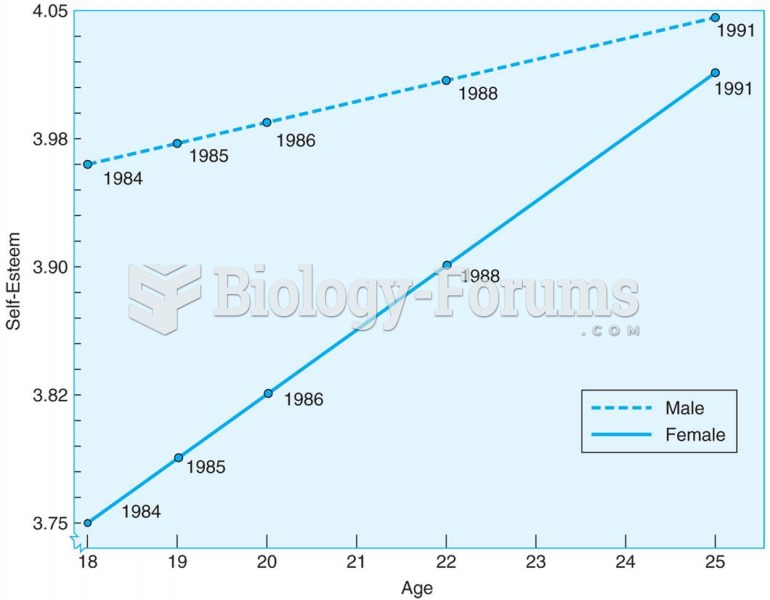 Young adults increase in self-esteem between the ages of 18 and 25, according to this longitudinal s
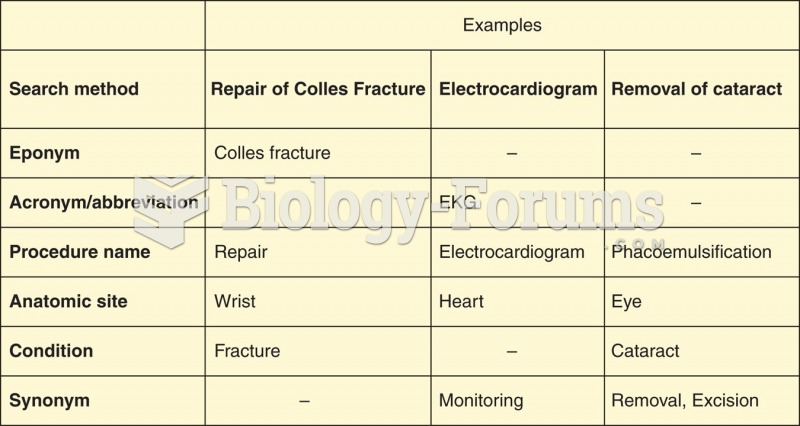 Alternative methods for locating the CPT Main Term.
 A planar design zirconia oxygen sensor places all of the elements together, which allows the sensor ...
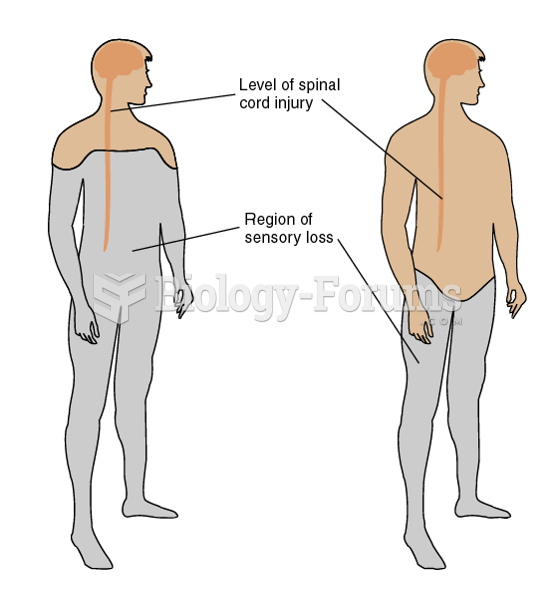 Effects of Spinal Cord and Autonomic System Damage
 How to fit an exponential model to data
 Satellite data showing net primary production. Productivity is coded as red (highest) down through o