This topic contains a solution. Click here to go to the answer
|
|
|

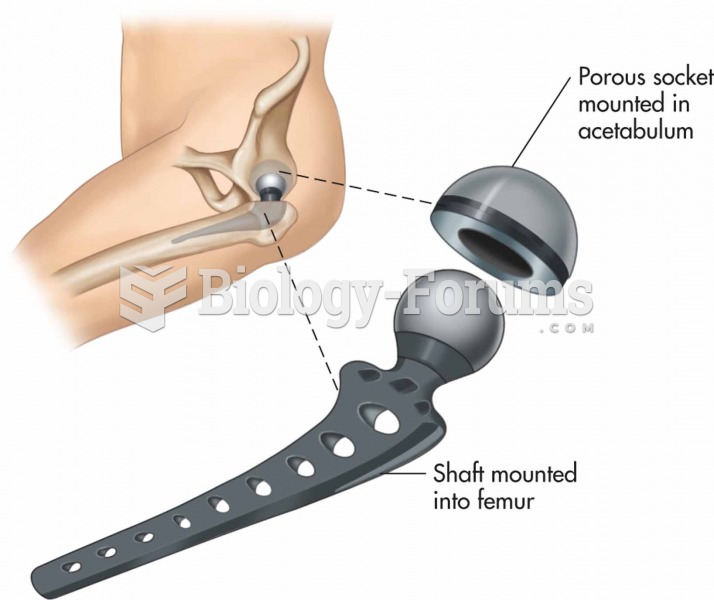 Total hip prosthesis.
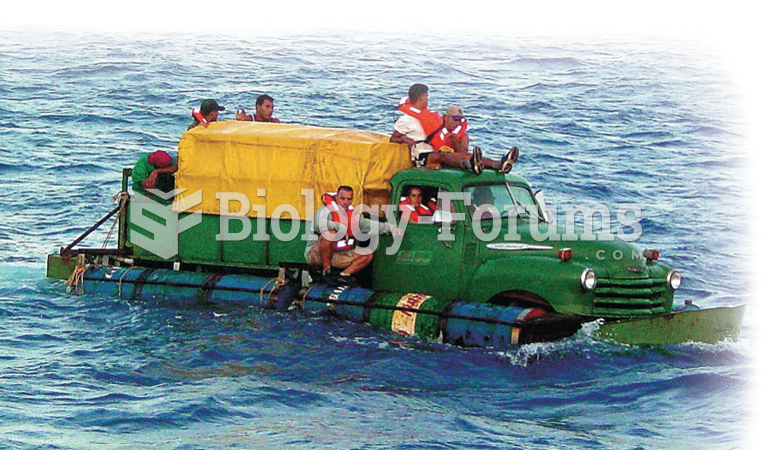 For millions of people, the United States represents a land of opportunity and freedom from ...
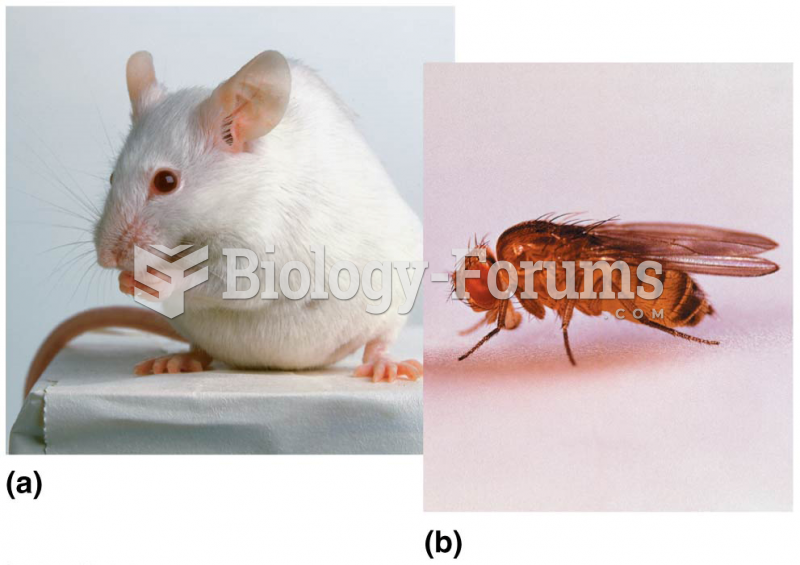 The first generation of model organisms in genetic analysis
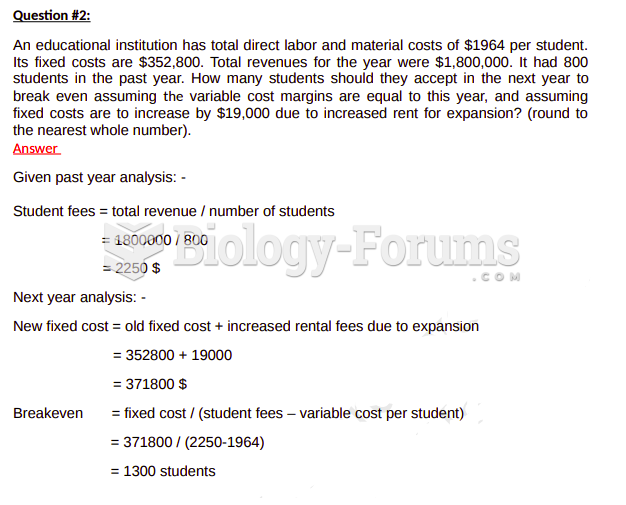 An educational institution has total direct labor and material costs of $1964 per student. Its ...
 Frequency Analysis of Letters Used in the English Language
 Allelic phase analysis in human families A and B