This topic contains a solution. Click here to go to the answer
|
|
|

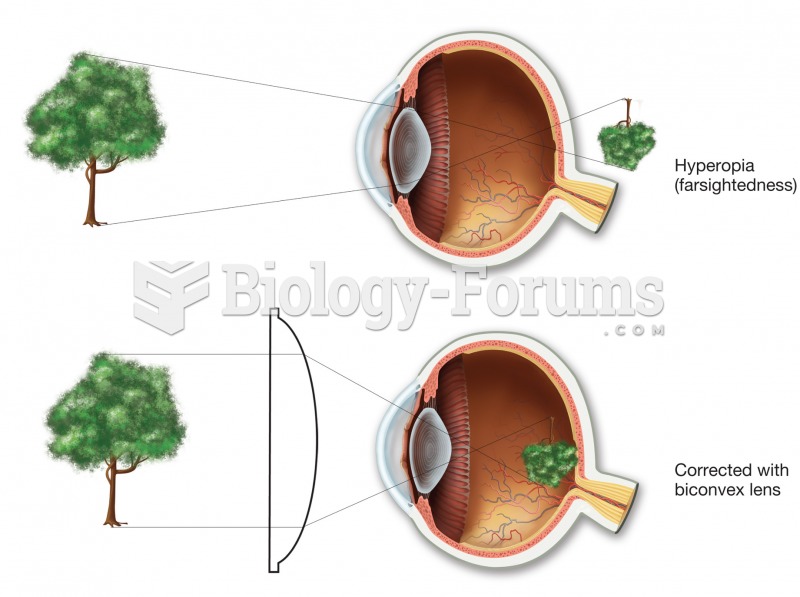 Hyperopia (farsightedness). In the uncorrected top figure, the image would come into focus behind th
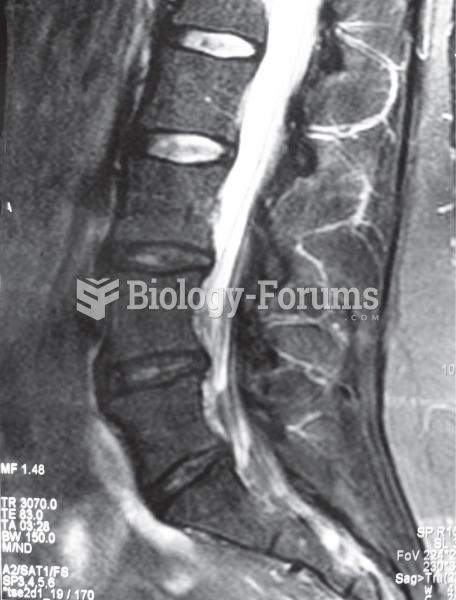 Magnetic resonance imaging (MRI) image demonstrating a back herniated disk.
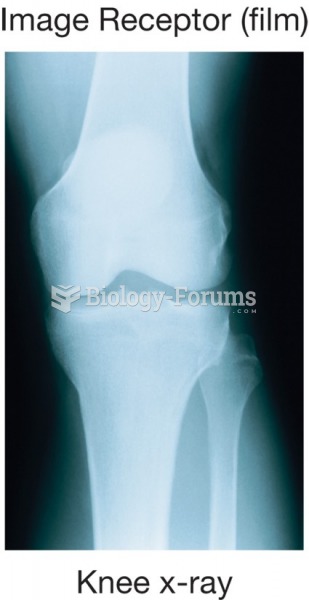 Bones do not allow the X-ray beam to pass through them, resulting in an image of the bones on the ...
 How to create a table of values displaying commission and earnings (Question 2)
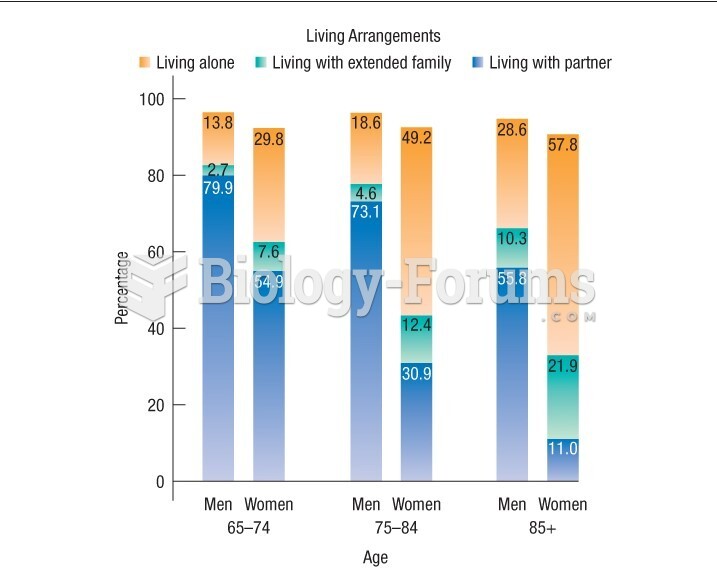 Graph shows the living arrangements of Canadian seniors
 Finding the graph of a Parabola using certain values