This topic contains a solution. Click here to go to the answer
|
|
|

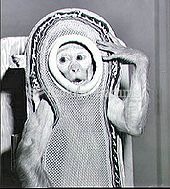 Sam, a rhesus macaque, was flown to a height of 55 miles (89 km) by NASA in 1959
 Representatives of many tomato lines
 Thyroidectomy. In this procedure, the thyroid gland is accessed by a vertical incision through the n
 This advertisement from about 1885 represents an early stage of capitalism when individuals were ...
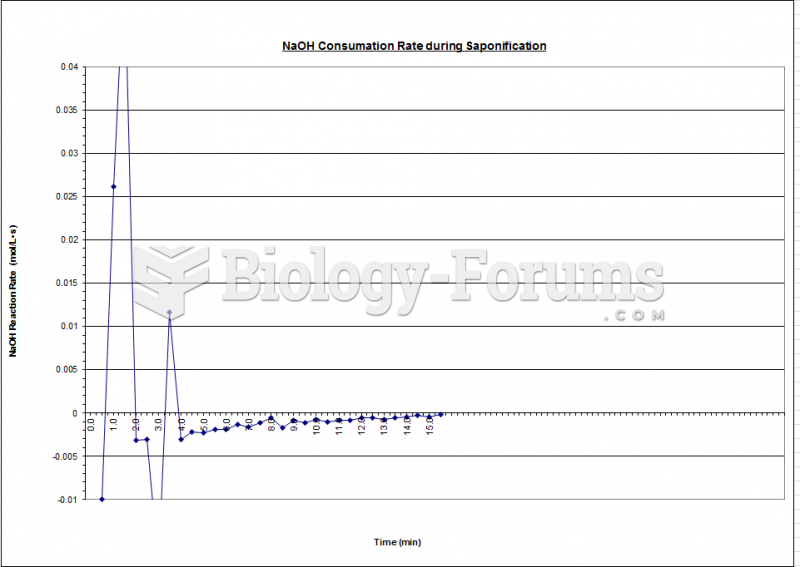 Fluidization - Reaction Rate Chart
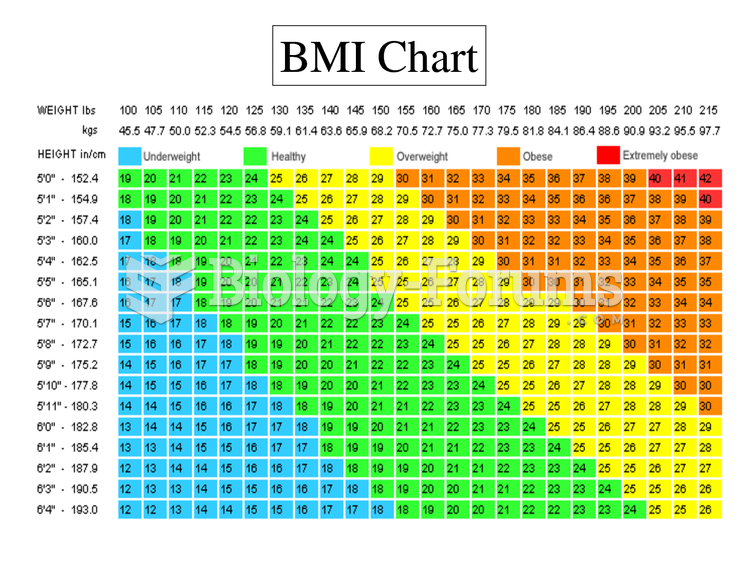 BMI Chart Weight Chart