This topic contains a solution. Click here to go to the answer
|
|
|

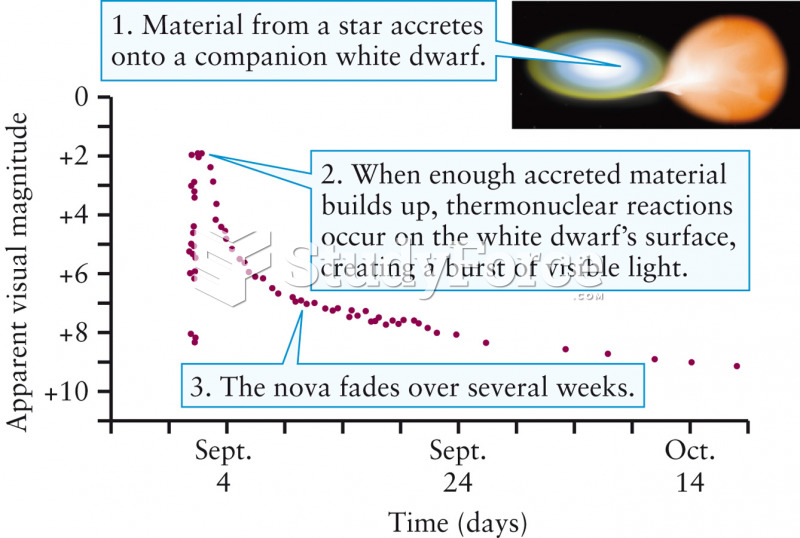 The Light Curve of a Nova
 Good body mechanics when facing the table directly. A. Head and back in alignment. B. Legs and feet ...
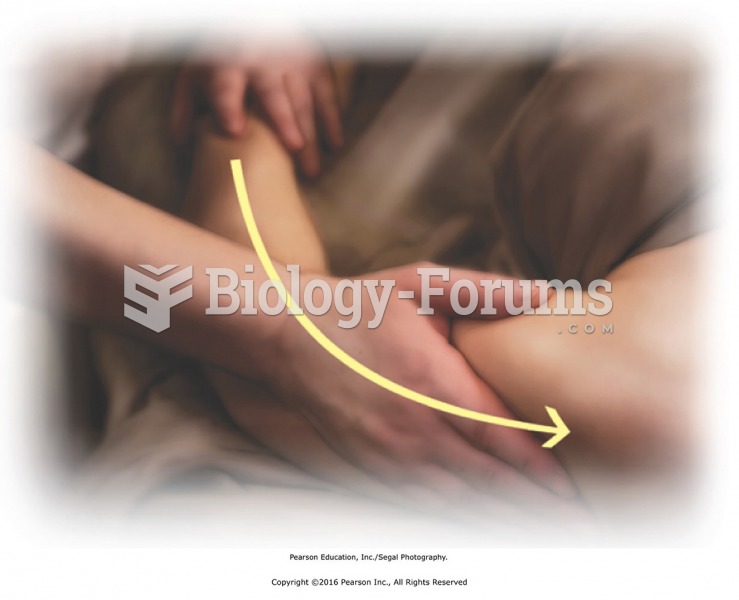 With the arm placed on the table, apply effleurage over the entire upper limb as a reconnecting and ...
 Using the measuring device to give the correct dose to children
 8.The following table contains DNA-sequence information compiled by Marilyn Kozak (1987). The ...
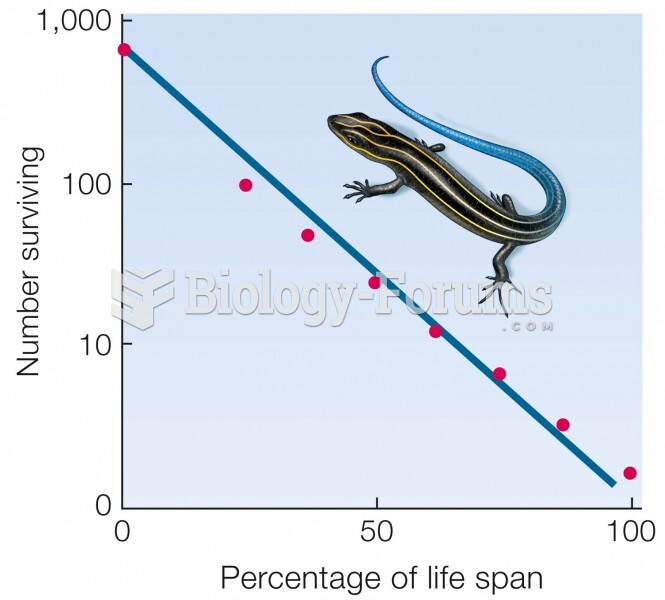 Type II curve. Mortality does not vary with age. Data for five-lined skink (Eumeces fasciatus).