This topic contains a solution. Click here to go to the answer
|
|
|

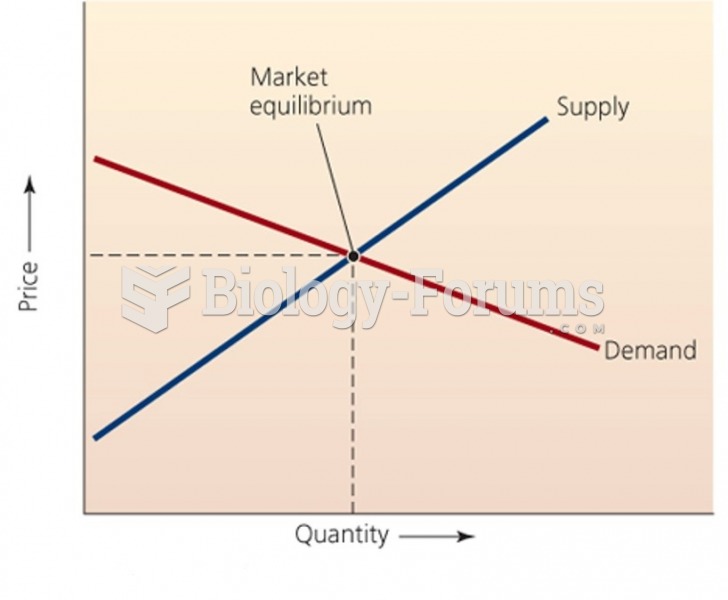 Classic Supply - Demand Curve
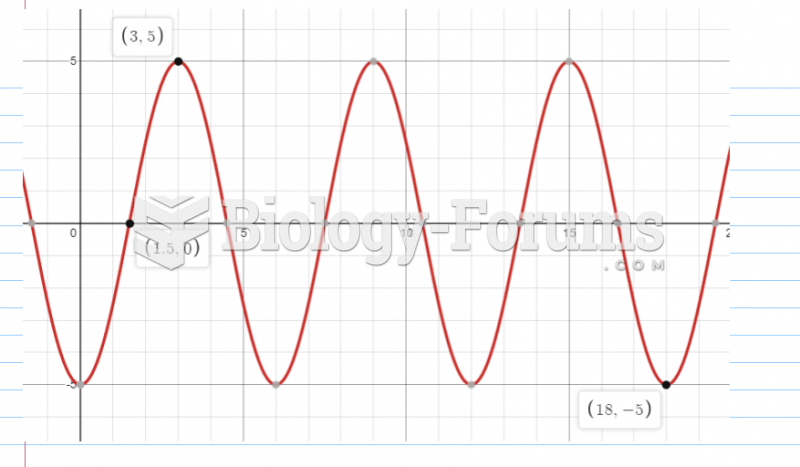 Sketch a graph of the function h(x), by hand on the following interval:
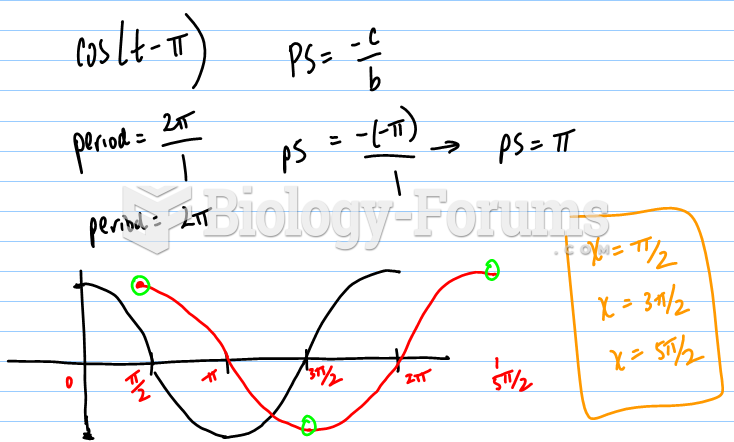 IROC on a Graph Questions
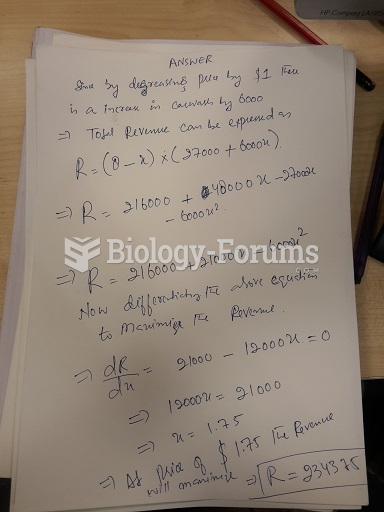 A car wash reduced the price of a basic wash as a promotion and test of the market. With the ...
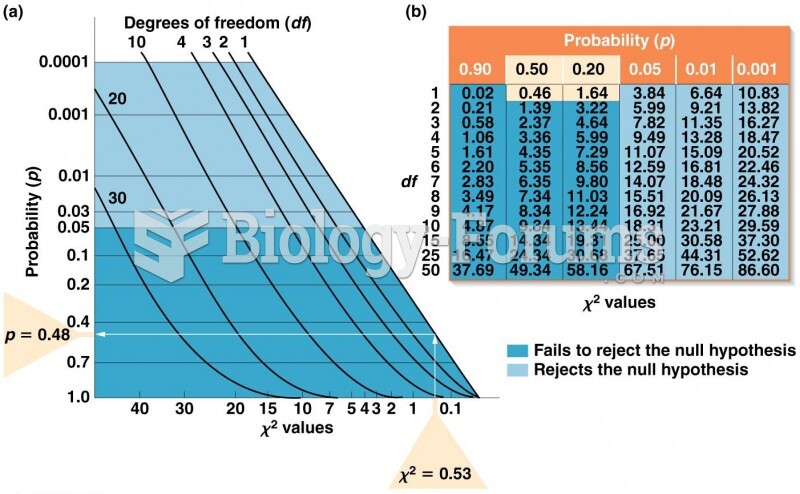 (a) Graph for converting values to p values. (b) Table of values for selected values of df
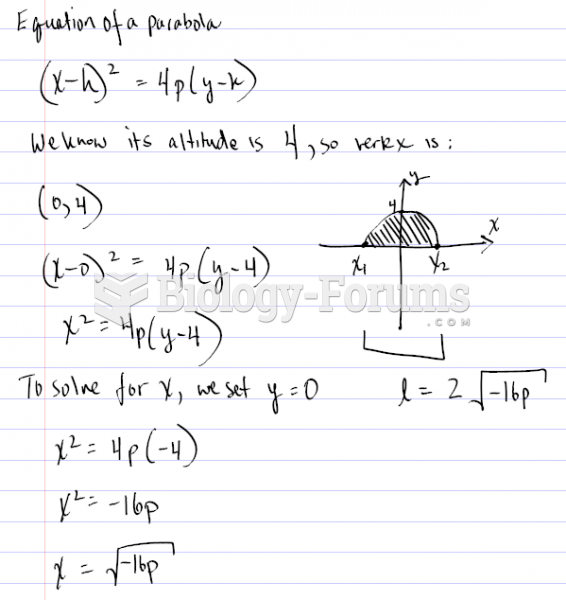 Finding the graph of a Parabola using certain values