This topic contains a solution. Click here to go to the answer
|
|
|

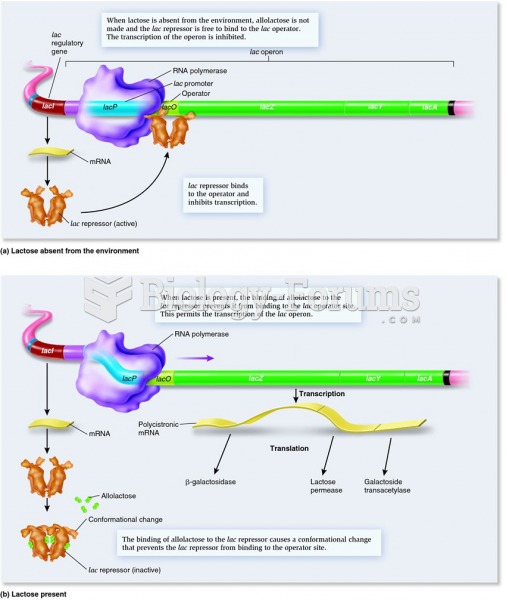 Negative control of an inducible set of genes: function of the lac repressor in regulating the lac o
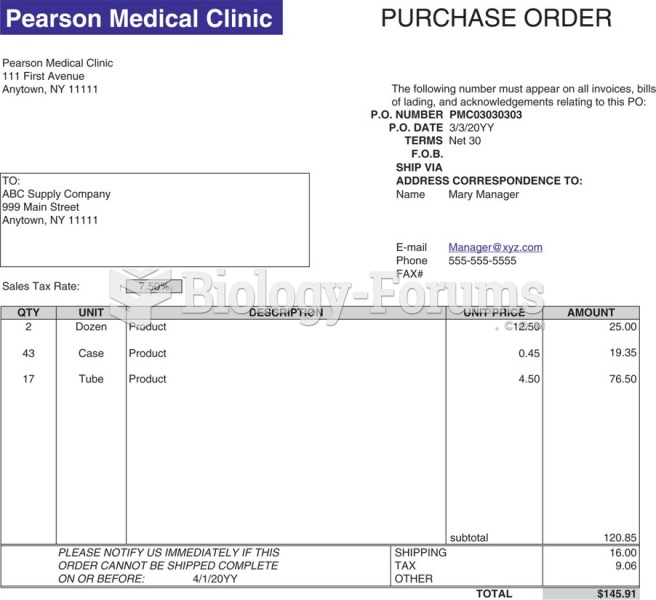 Sample purchase order form.
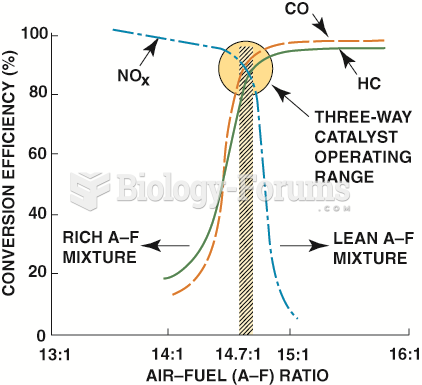 With a three-way catalytic converter, emission control is most efficient with an air–fuel ratio ...
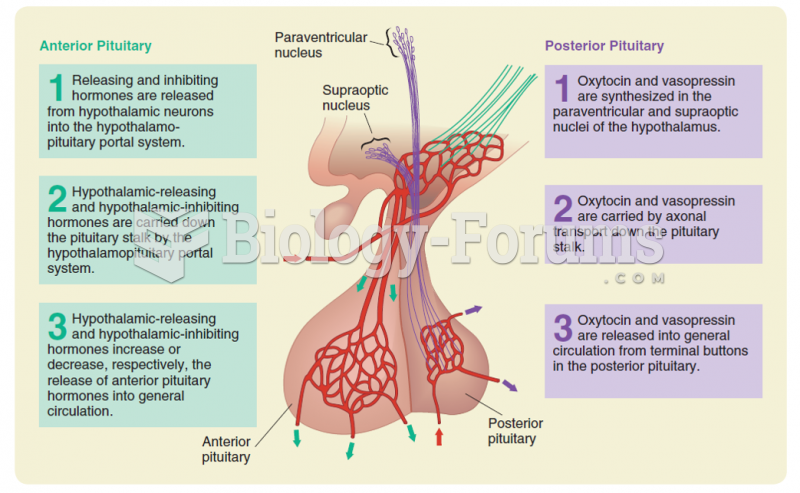 Control of the anterior and posterior pituitary by the hypothalamus.
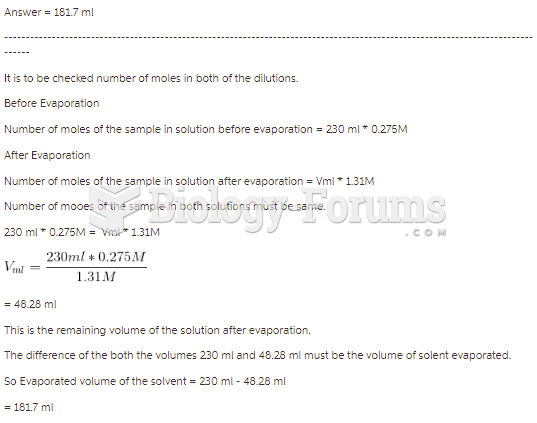 A 230.0-mL sample of a 0.275 M solution is left on a hot plate overnight; the following morning ...
 Manhattan plots resulting from a genome-wide association study of seven common human disease