This topic contains a solution. Click here to go to the answer
|
|
|

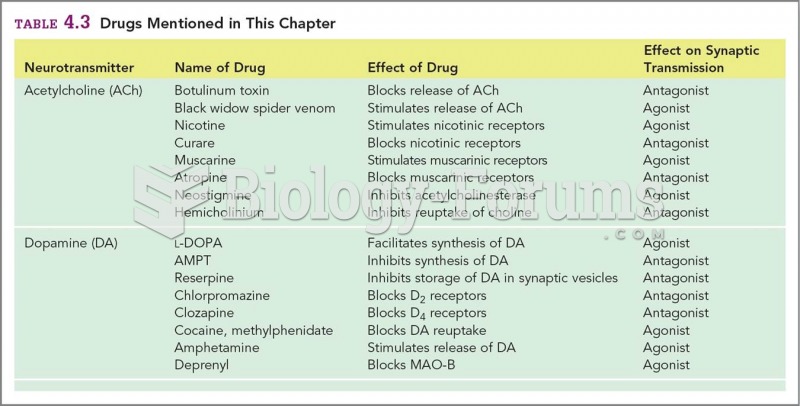 Drugs and their effect table
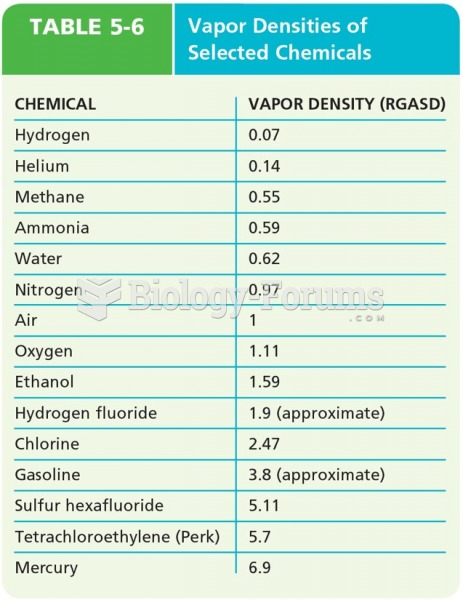 Vapor Densities of Selected Chemicals
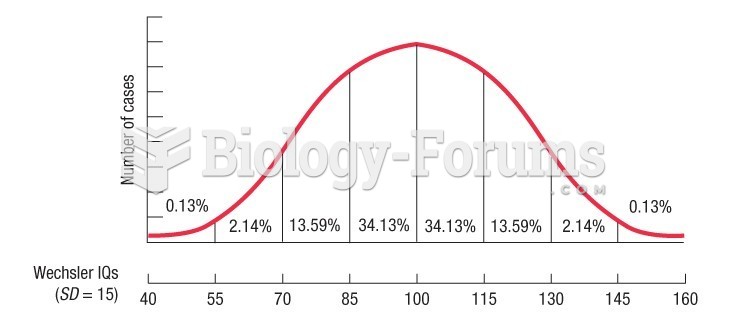 IQ scores form what mathematicians call a normal distribution "bell curve"
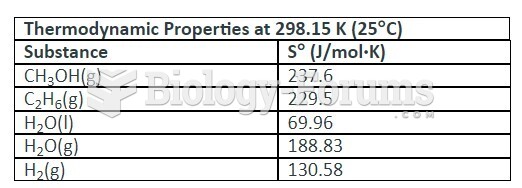 table
table
 Construct a Lorenz curve that shows income distribution in this society.
 Insect Body Plan: Grasshopper