This topic contains a solution. Click here to go to the answer
|
|
|

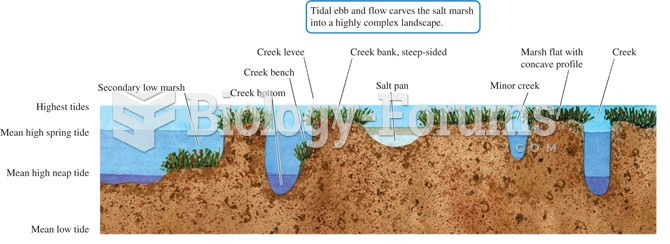 Salt marsh channels shown in cross section.
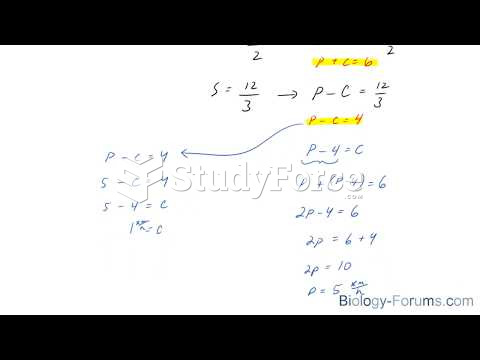 How to solve a distance, time, speed problem using linear algebra
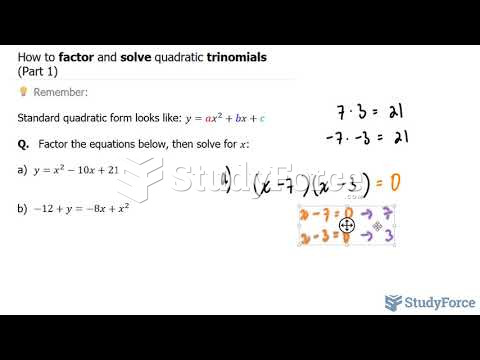 How to factor and solve quadratic trinomials (Part 1)
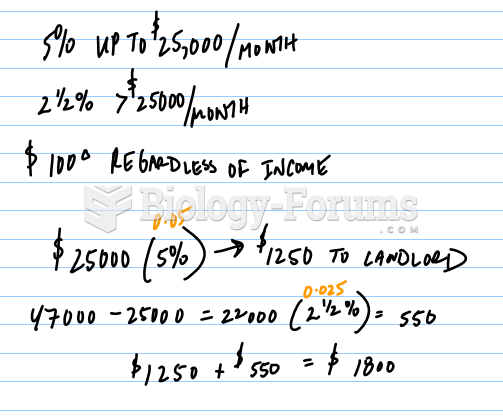 Please help me with a Real Estate Course Problem
 Problem
 Solve the system to find x and y