This topic contains a solution. Click here to go to the answer
|
|
|

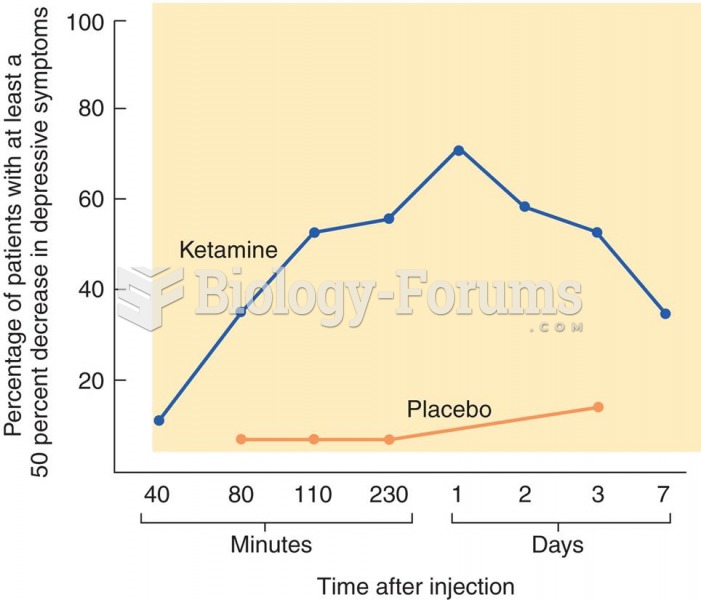 Treatment of Depression with Ketamine The graph shows the effects of ketamine on symptoms of depress
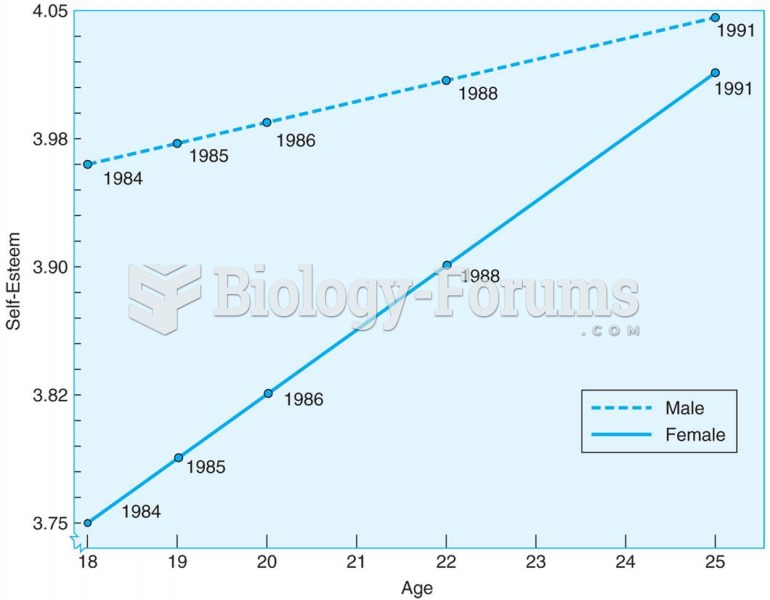 Young adults increase in self-esteem between the ages of 18 and 25, according to this longitudinal s
 Sample Exercise Program for Healthy Older Adults
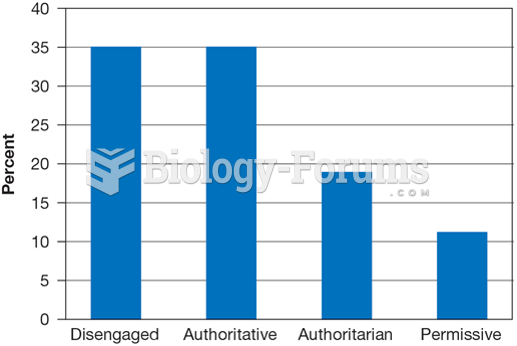 Parenting Styles Reported by a Representative Sample of American Adolescents
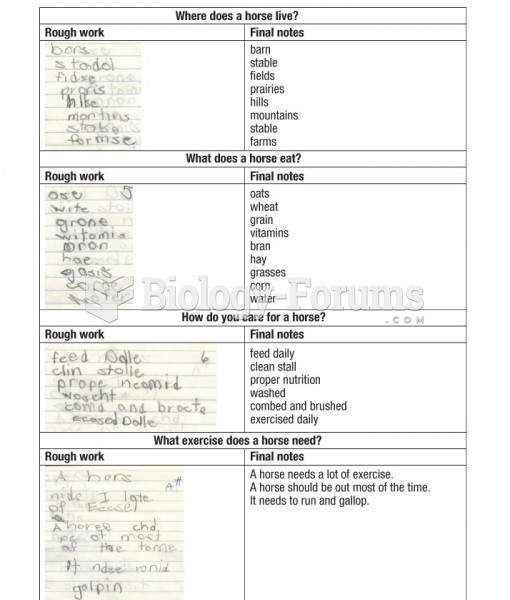 A sample of work by a Grade 4 student with a specific learning disorder
 Lemon shark giving birth to young that recently hatched in her body. The young were nourished by egg