This topic contains a solution. Click here to go to the answer
|
|
|

 The cranium of a young infant changes dramatically in shape with age. Initially the child has severa
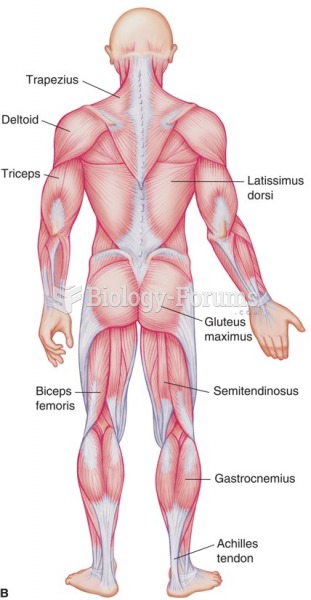 Selected skeletal muscles and the Achilles tendon (posterior view).
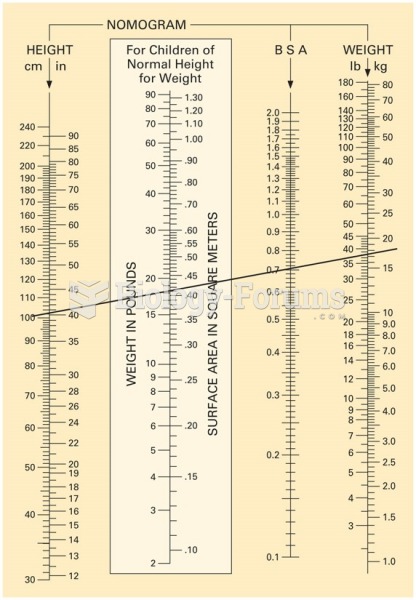 Nomogram chart. This example shows a line drawn from a child’s height of 100 cm to his weight, 35 ...
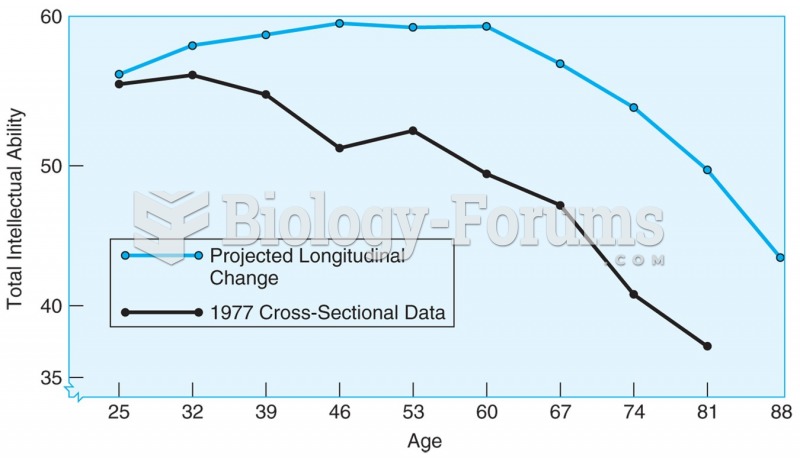 4.1 Age changes in total IQ based on cross-sectional data (lower line) and longitudinal data ...
 Consumerism and Sustainability: Food from Farm to Table
 Growth Accounting for Europe, A.D. 500–1700