This topic contains a solution. Click here to go to the answer
|
|
|

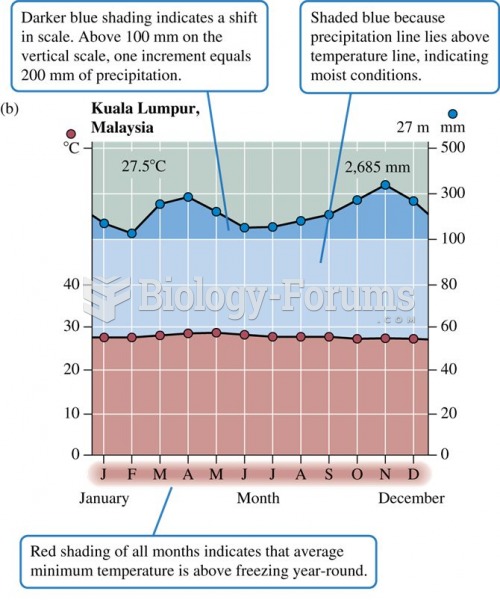 (a) Climate diagram for a hot desert climateâ€â€ÂYuma, Arizona.
 An example of a Hertzsprung–Russell diagram for a set of stars that includes the Sun
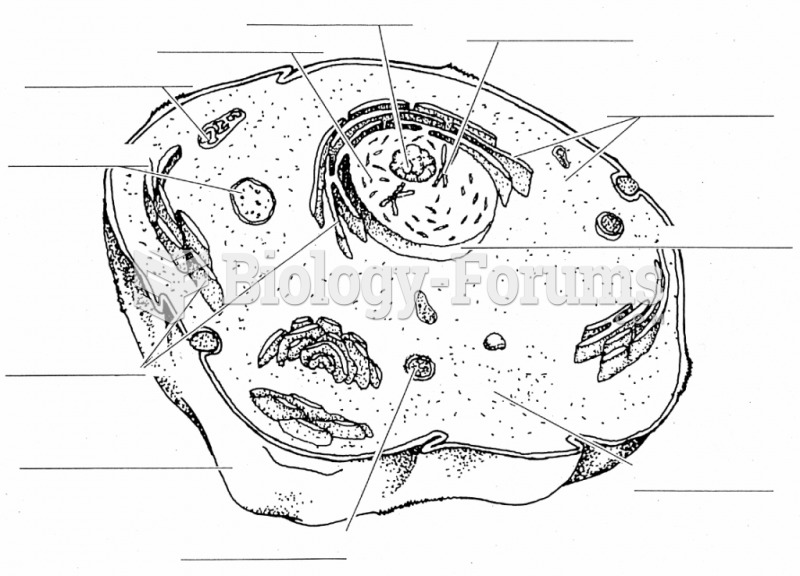 Blank cell diagram
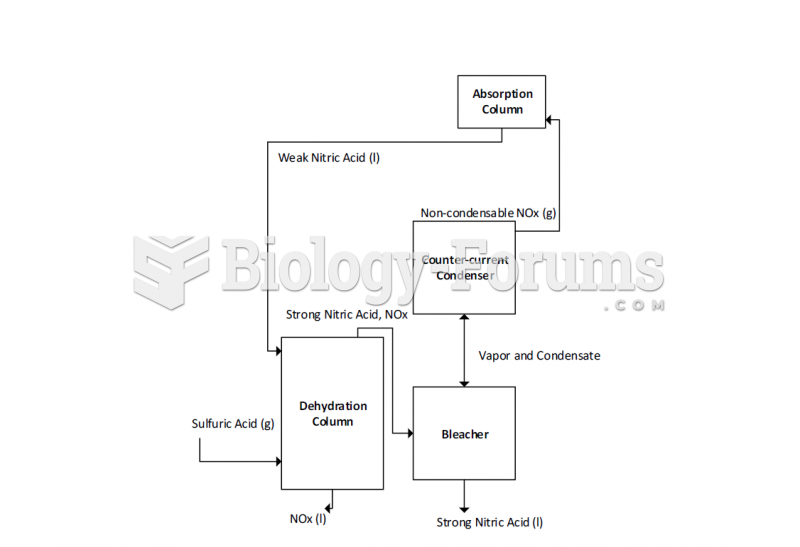 Block Diagram of a High Concentrate Nitric Acid System for Dual-Stage Pressure Production of Nitric
 Figure-8s on the toes mobilize joints of the foot.
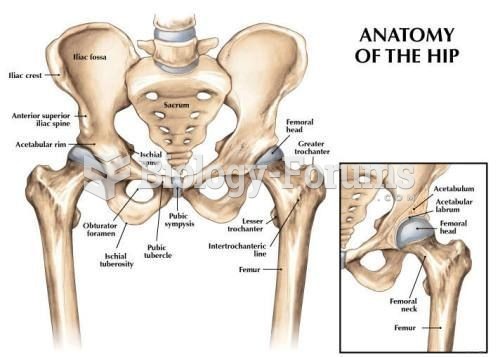 Hip anatomy diagram