Question 1
The diagram below shows the supply and demand for labour in a competitive labour market.

FIGURE 14-6
Refer to Figure 14-6. Suppose this labour market is perfectly competitive. If a minimum wage of $30 were imposed, the quantity of labour supplied would be
◦ 140.
◦ 210.
◦ 280.
◦ 350.
◦ 420.
Question 2
The diagram below shows the supply and demand for labour in a competitive labour market.
FIGURE 14-6
Refer to Figure 14-6. Suppose this labour market is perfectly competitive. If a minimum wage of $35 were imposed, the quantity of labour supplied would be
◦ 140.
◦ 210.
◦ 280.
◦ 350.
◦ 420.

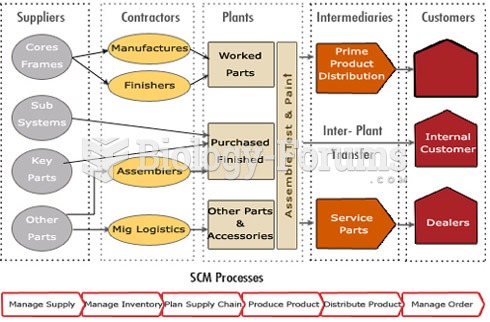 supply chain
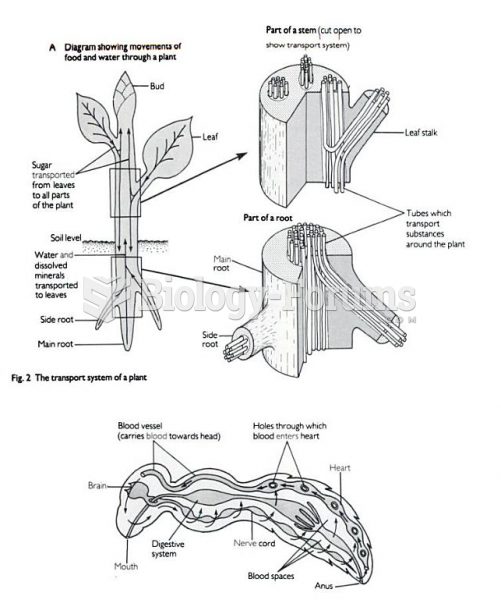 Plant Diagram
 diagram
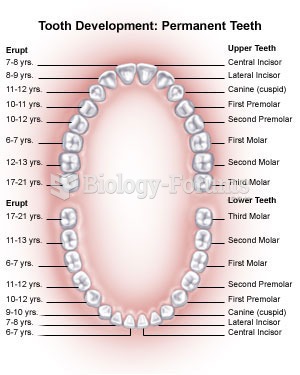 teeth diagram
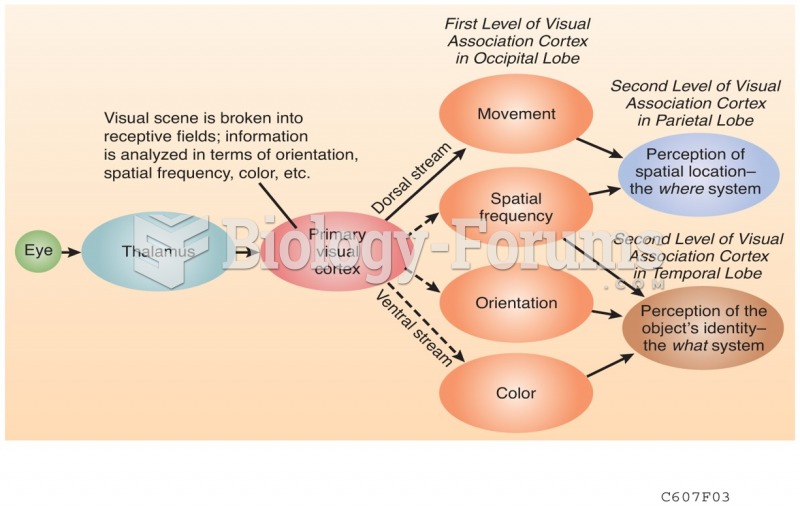 Schematic Diagram
 Economic recession in 2008 saw a small decrease in demand