This topic contains a solution. Click here to go to the answer
|
|
|

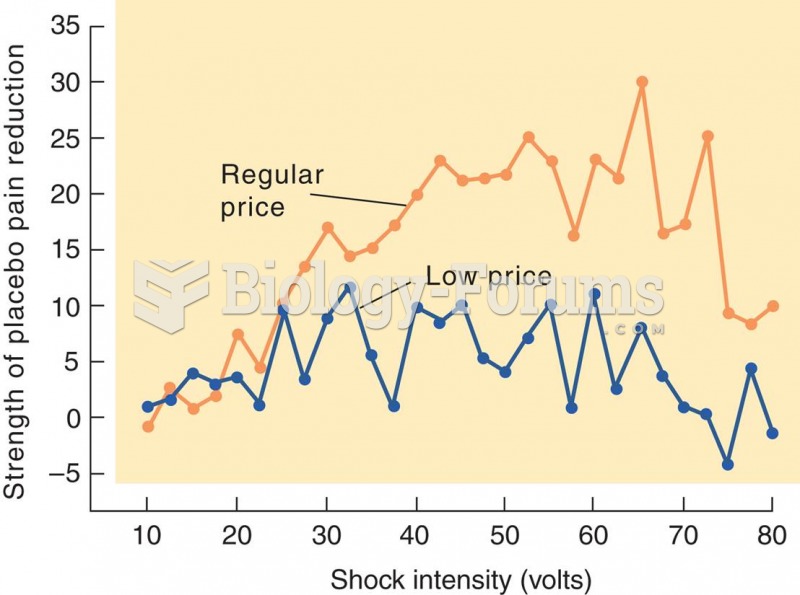 Effect of Perceived Price of a Drug on Placebo Analgesia
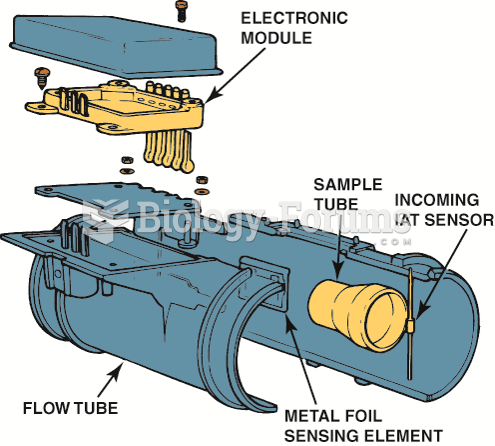 This five-wire mass air flow sensor consists of a metal foil sensing unit, an intake air temperature ...
 Find the lateral area, total surface area, and volume of the frustum
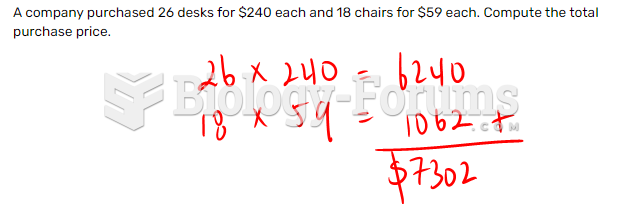 A company purchased 26 desks for $240 each and 18 chairs for $59 each. Compute the total ...
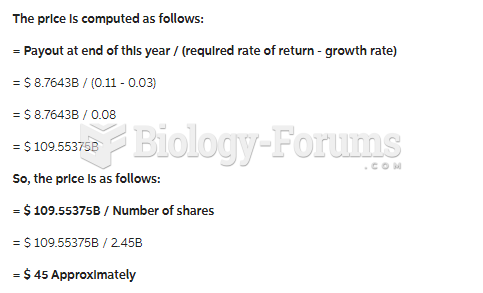 Analysts expect Virtucon to make payouts of $8.7643B at the end of this year. Assume that all ...
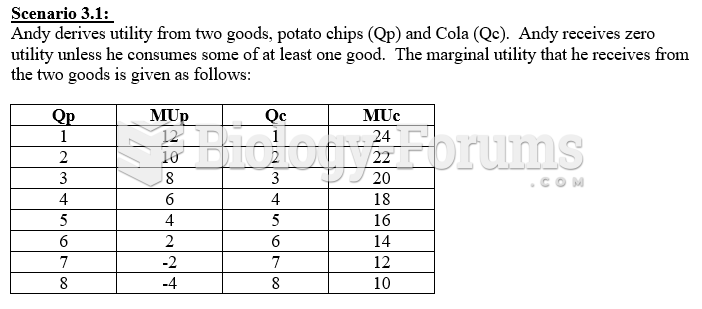 Refer to Scenario 3.1. If the price of potato chips is $0.50 and the price of Cola is $4.00, ...