This topic contains a solution. Click here to go to the answer
|
|
|

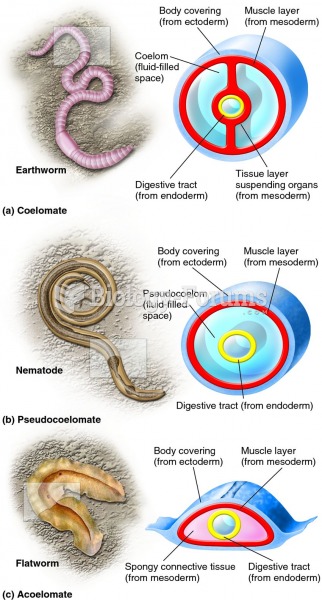 The three basic body plans of bilaterally symmetrical animals.
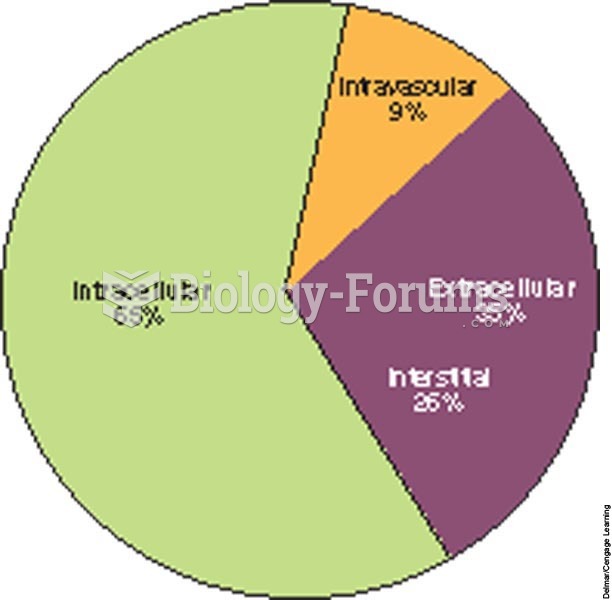 Body fluid compartments of an adult.
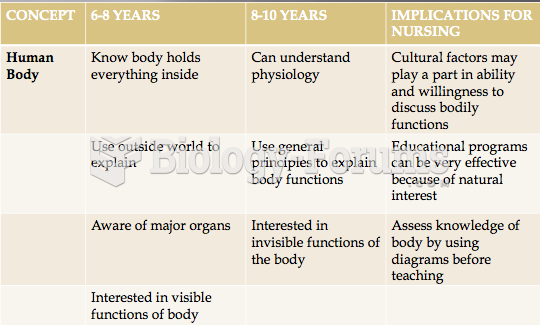 Human Body by Children
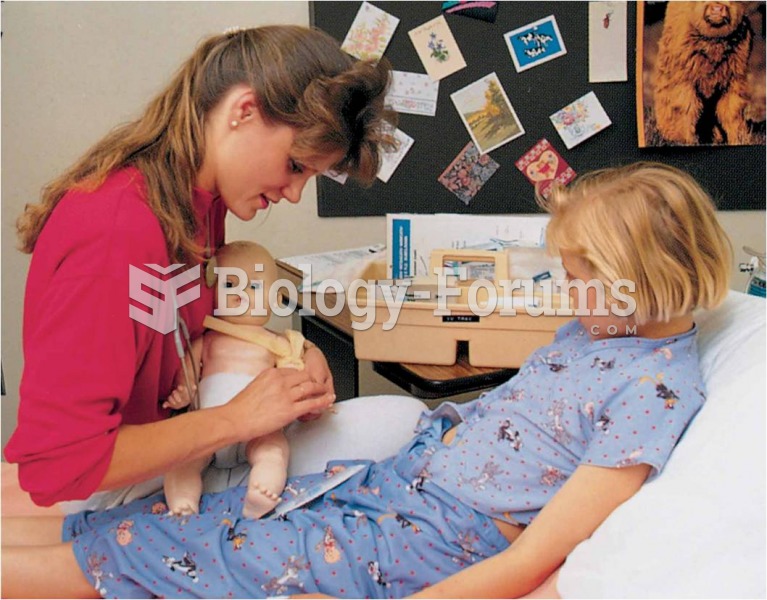 Treating the younger school-age child
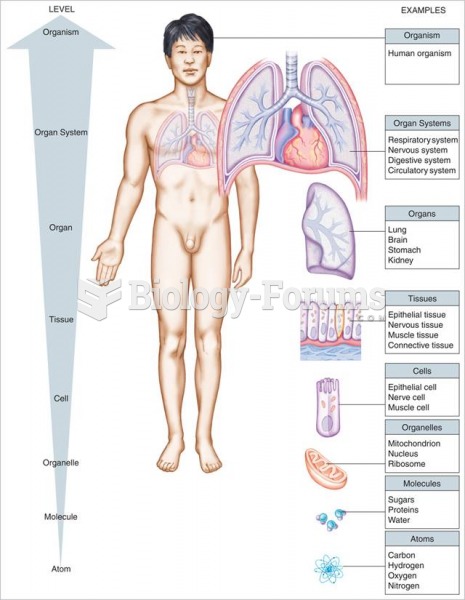 Organization of the human body.
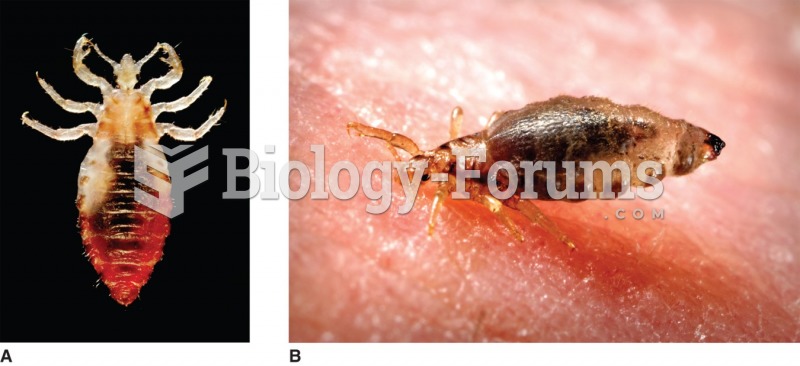 A) Male body louse. (Courtesy of the Centers for Disease Control and Prevention/Frank Collins, Ph.D. ...