This topic contains a solution. Click here to go to the answer
|
|
|

 Head impact during sports may reduce ability to acquire new information
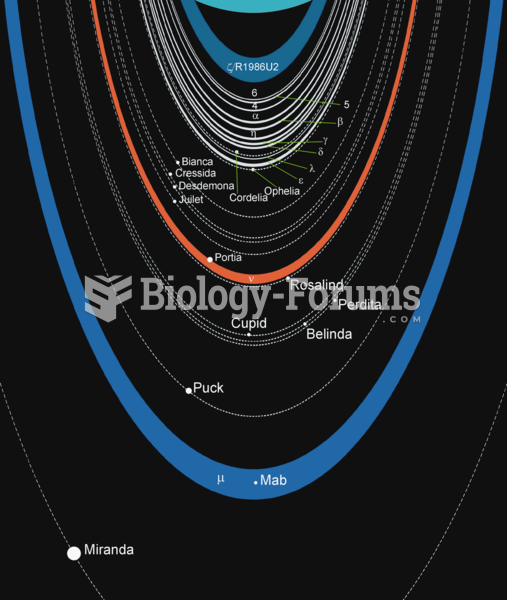 The Uranian ring system
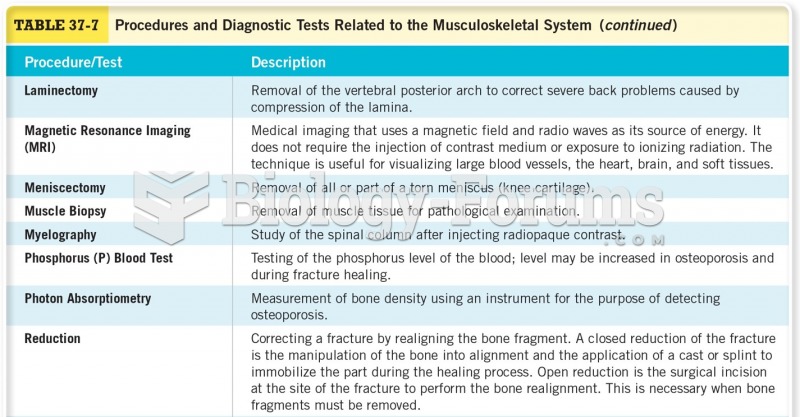 Procedures for Diagnostic Tests Related to the Musculoskeletal system
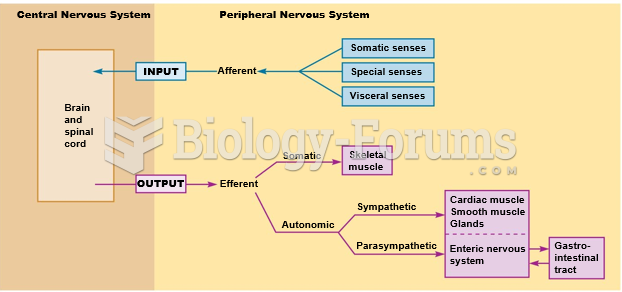 Organization of the nervous system.
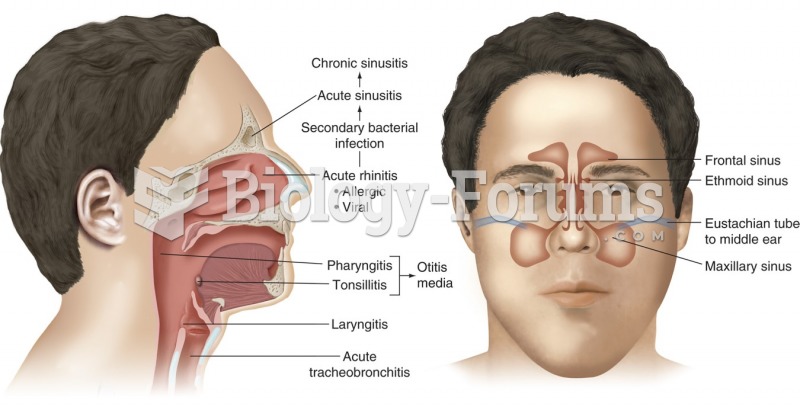 Paranasal sinuses are part of the upper respiratory system. From here, infections may spread via the ...
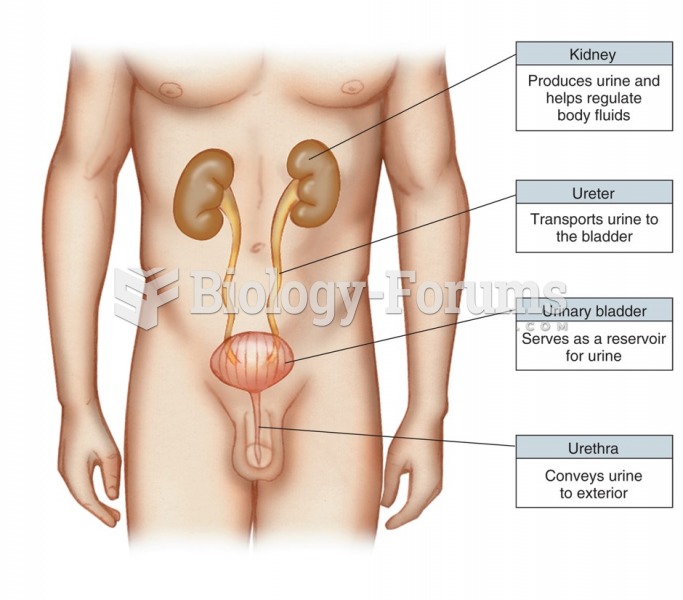 The urinary system.