This topic contains a solution. Click here to go to the answer
|
|
|

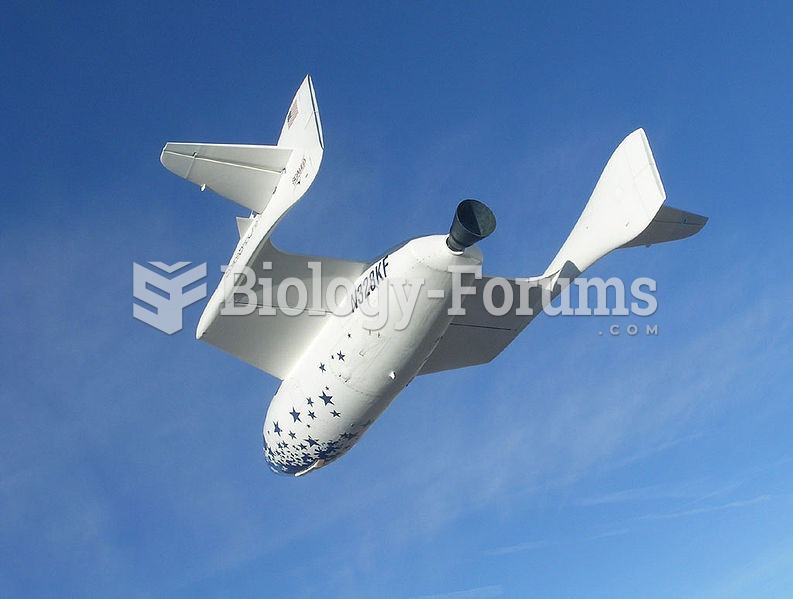 SpaceShipOne completed the first manned private spaceflight in 2004, reaching an altitude of 100.124
 The reminder card should be completed and handed to the patient after the appointment is scheduled.
 Should School Meals Align with the Dietary Guidelines for Americans?
 Kids holding hands in school
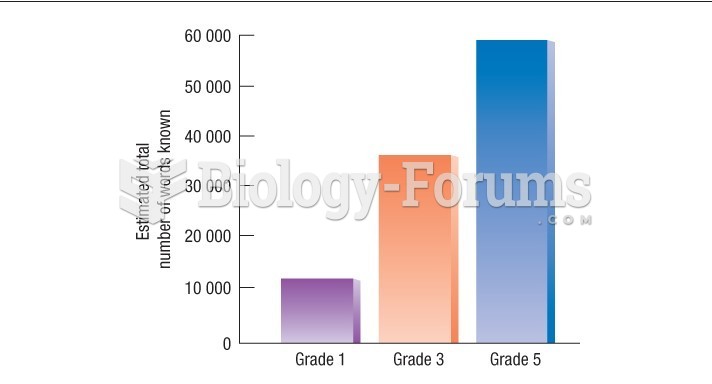 Anglin's estimates of the total vocabulary of children in Grades 1, 3, and 5
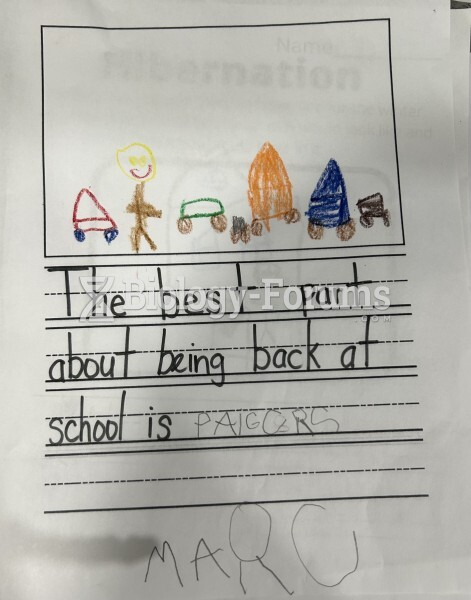 The best thing about back to school