This topic contains a solution. Click here to go to the answer
|
|
|

 (a) Zombies are a common theme in movies. However, (b) the number of zombie movies released each yea
 School age (late childhood): 6–12 years, or to puberty.
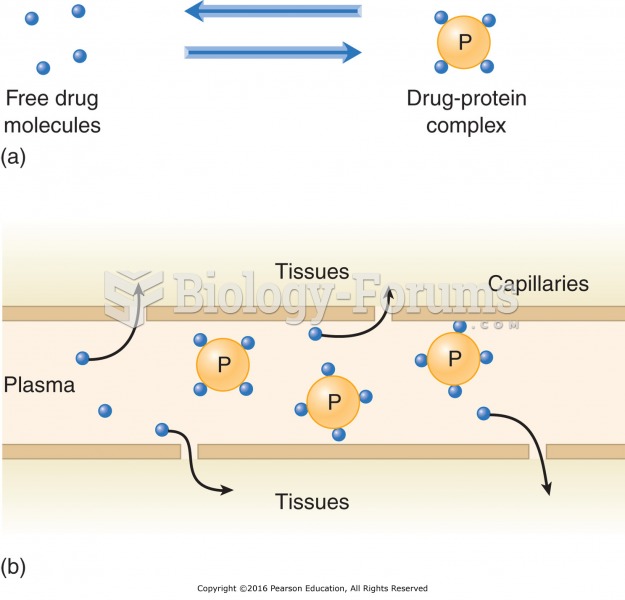 Plasma protein binding and drug availability: (a) The drug exists in a free state or is bound to ...
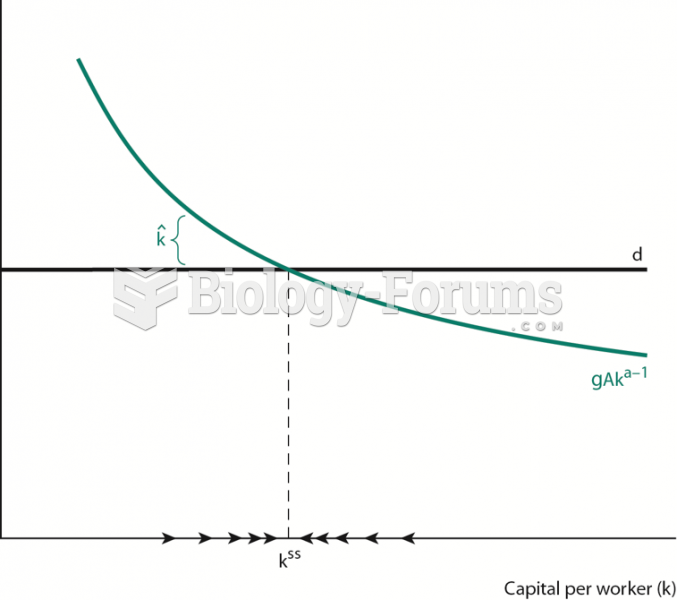 Speed of Convergence to the Steady State
 Estimated number of new HIV infections per year over time period in Canada
 Dragon Chinese new year 2023