This topic contains a solution. Click here to go to the answer
|
|
|

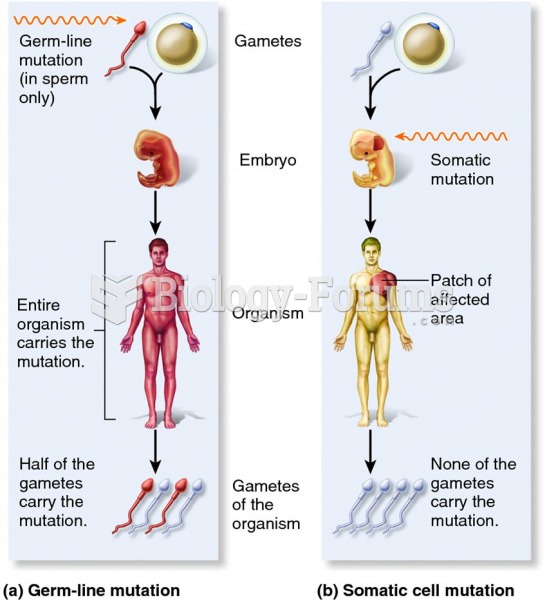 The effects of germ-line versus somatic cell mutations.
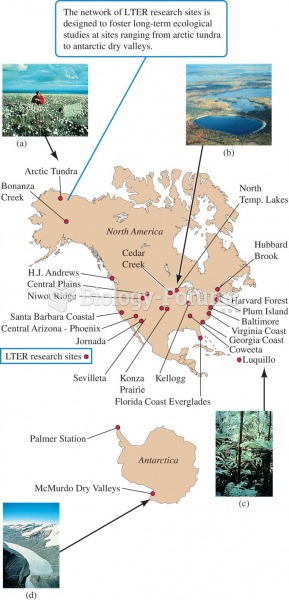 The U.S. Long-Term Ecological Research (LTER) network.
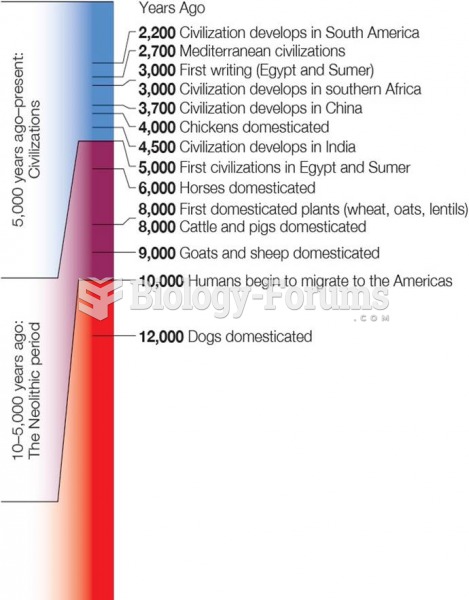 Time Line of Human History From Upper Paleolithic Period to the Present
 Three days after the Boston Marathon explosion, the FBI released this photograph that had been taken
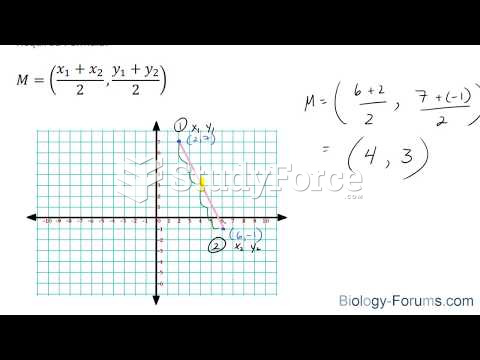 How to find the midpoint of a line segment
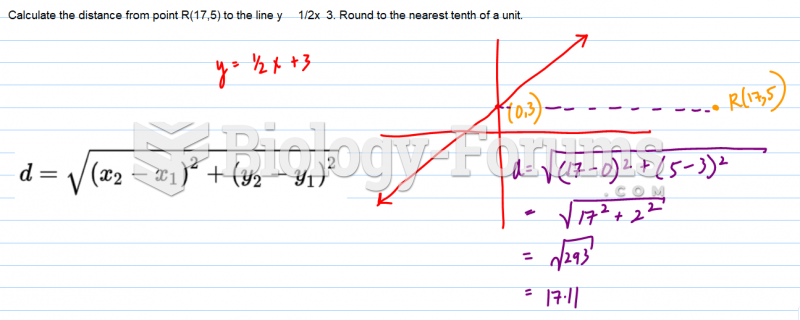 Calculate the distance from point R(17,5) to the line ... Round to the nearest tenth of a