This topic contains a solution. Click here to go to the answer
|
|
|

 New results from NASA's NEOWISE survey
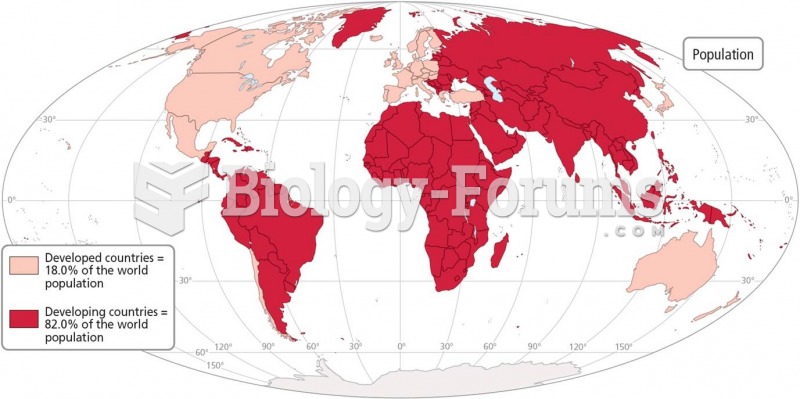 Worldwide Variations in Population and Income Levels Developed countries represent only 18% of the
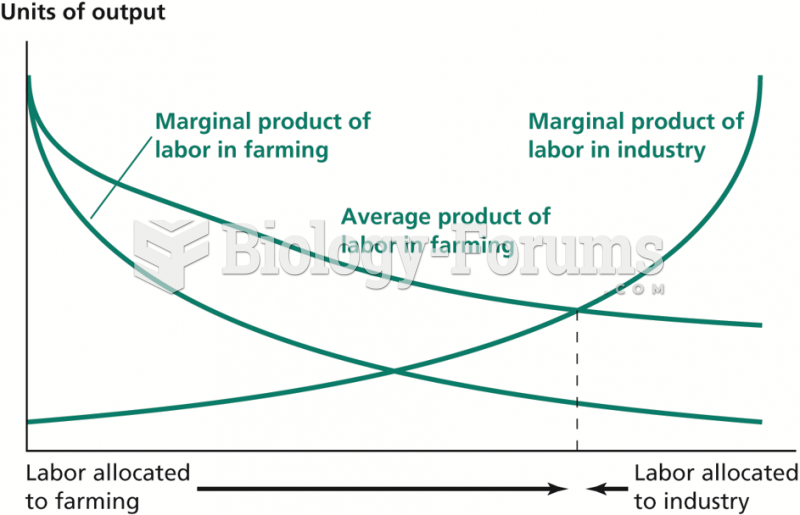 Overallocation of Labor to Farming When Farmworkers Are Paid Their Average Product
 Find the derivative using the product rule
 The phenotype of an organism is the product of interactions
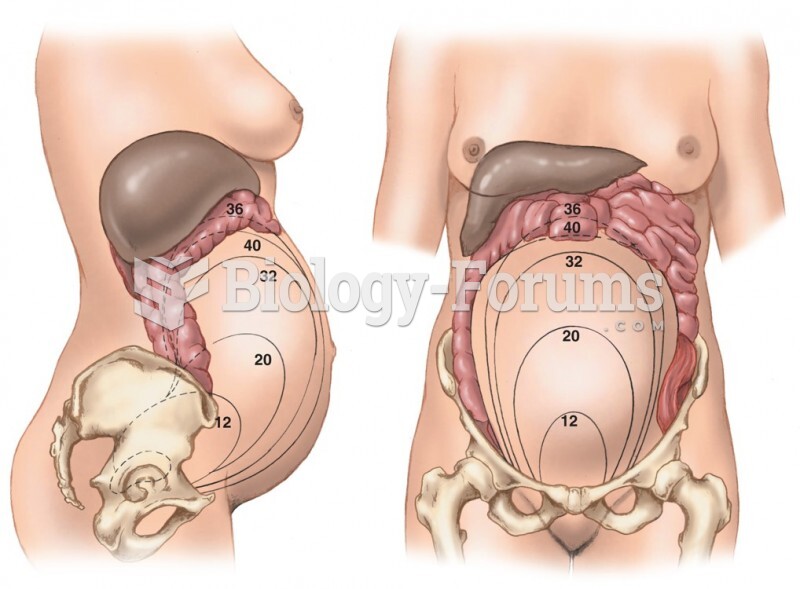 Changing Dimensions of the Pregnant Uterus. Numbers Represent Weeks of Gestation