Answer to Question 1
Answer: D
Explanation: D) A line chart illustrates trends over time or plots the relationship of two variables. In line charts that show trends, the vertical, or y, axis shows the amount, and the horizontal, or x, axis shows the time or other quantity against which the amount is being measured. You can plot just a single line or overlay multiple lines to compare different entities.
Answer to Question 2
Answer: C
Explanation: C) When you need to present detailed, specific information, choose a table, a systematic arrangement of data in columns and rows. Tables are ideal when your audience needs information that would be either difficult or tedious to handle in the main text.

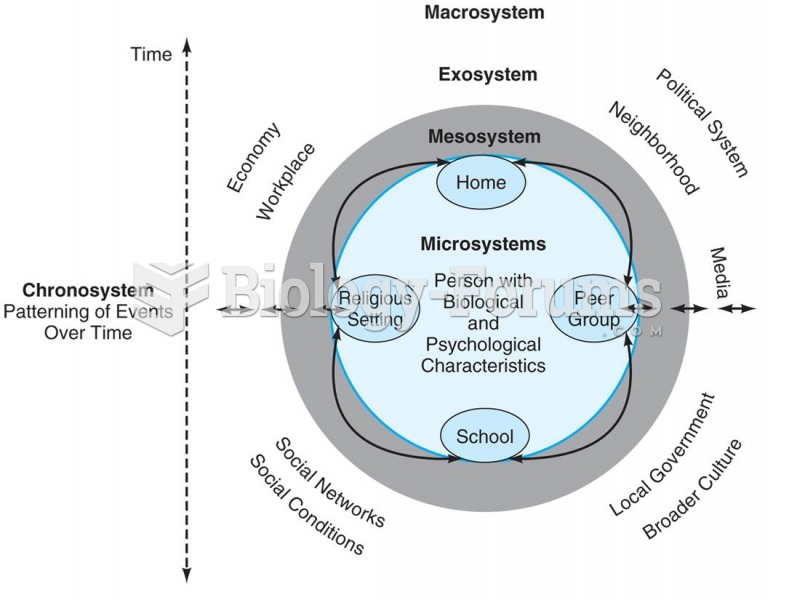 Bronfenbrenner’s model of the ecological-systems approach to studying development. He suggested that
 When young infants hold objects for a long period of time they eventually become habituated to them.
 Assessing the degree of the burn. Bottom photos show (A) first-degree burn (sunburn) and (B) ...
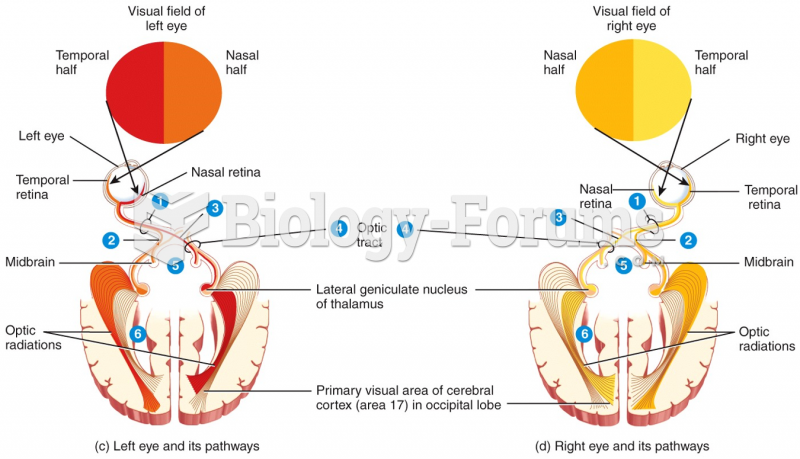 The two visual fields of each eye are nasal (medial) and temporal (lateral)
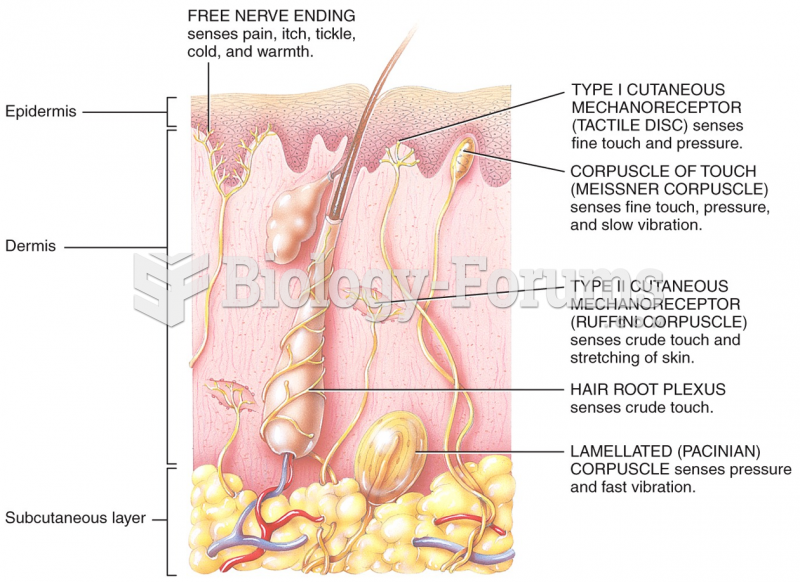 TYPE I and TYPE II CUTANEOUS MECHANORECEPTORS
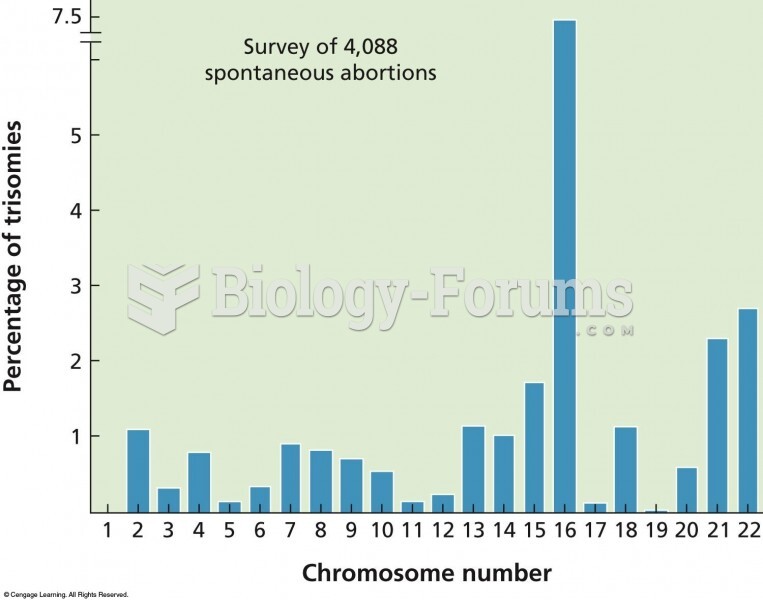 The results of a cytogenetic survey of over 4,000 miscarriages show a wide variation in how often sp