|
|
|

 Pocket gophers and ecosystem structure (data from Huntly and Inouye 1988).
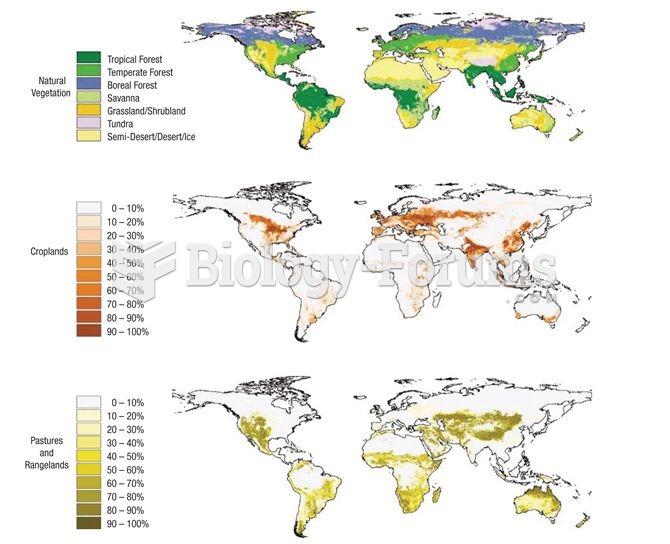 Extent of agricultural activity across the planet (data from Foley et al. 2005).
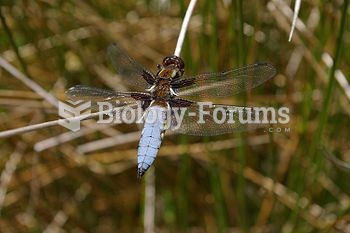 A male Broad-bodied Chaser
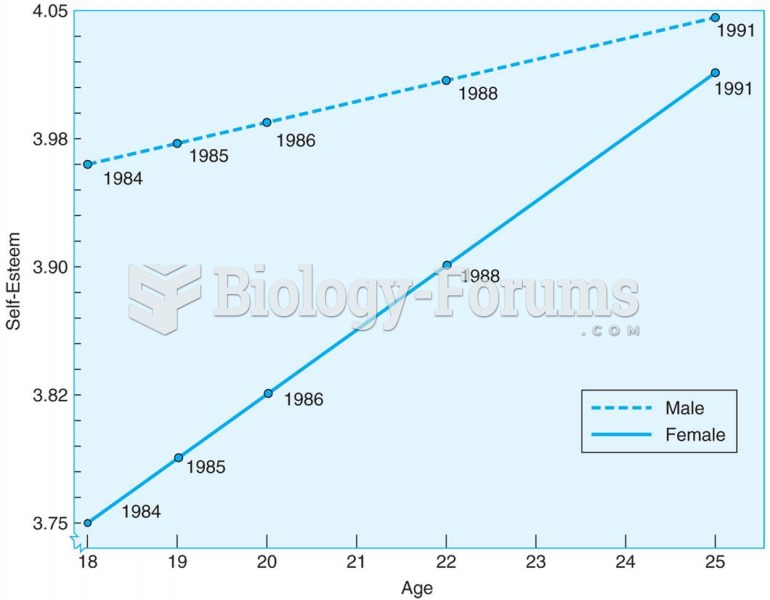 Young adults increase in self-esteem between the ages of 18 and 25, according to this longitudinal s
 A physician uses a portable electronic tablet to enter patient data while in the examination room.
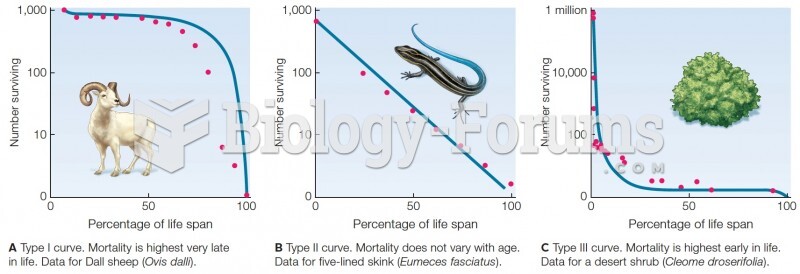 Survivorship curves. Blue lines are theoretical curves. Red dots are data from field studies.