|
|
|

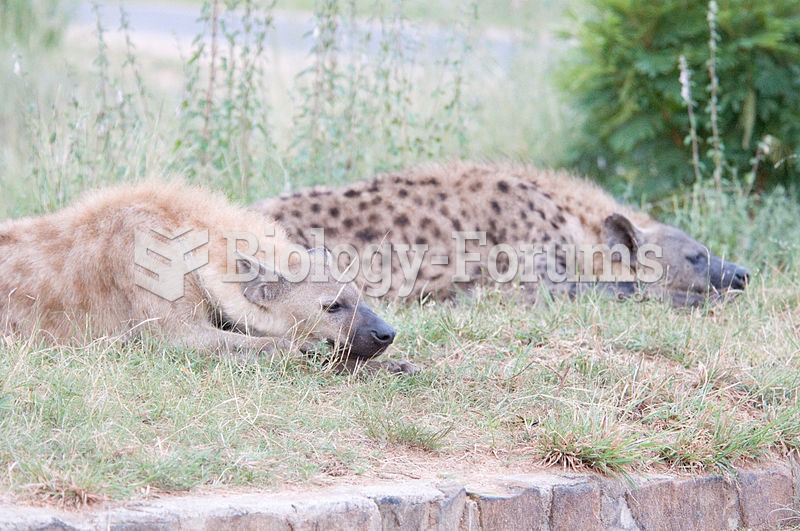 A pair of spotted hyenas at White River, Mpumalanga
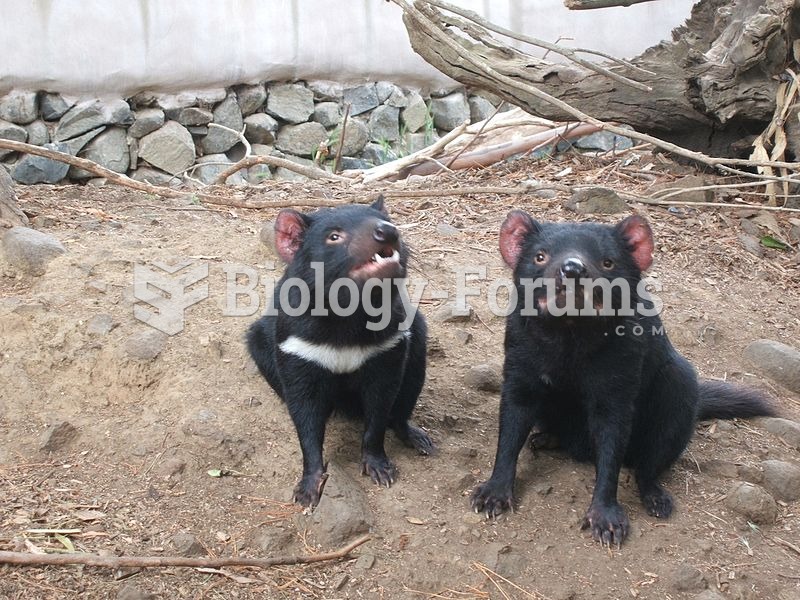 Two devils, one without any white markings. Around 16% of wild devils have no markings.
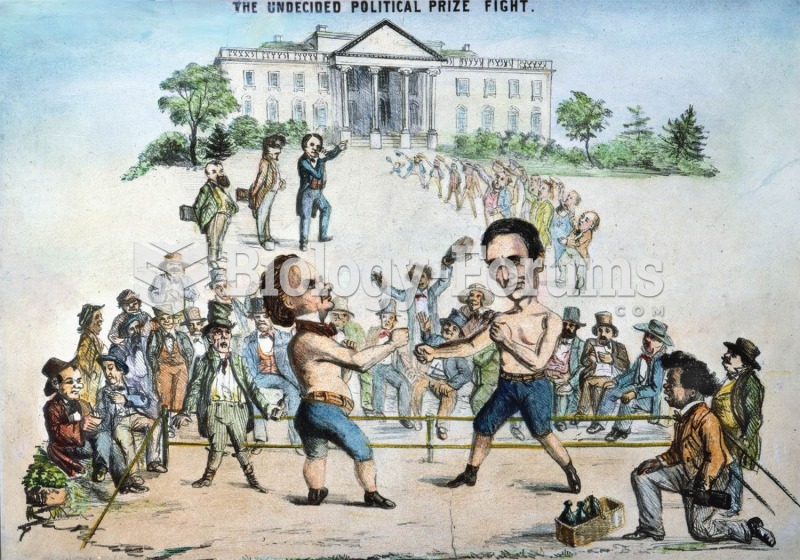 That politics was always a rough business is shown in this cartoon, which shows Lincoln, assisted by
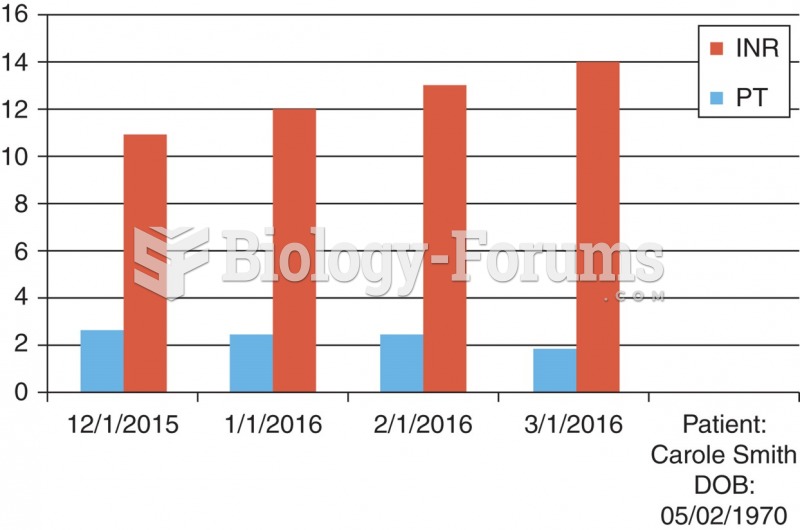 A chart derived from a flow sheet.
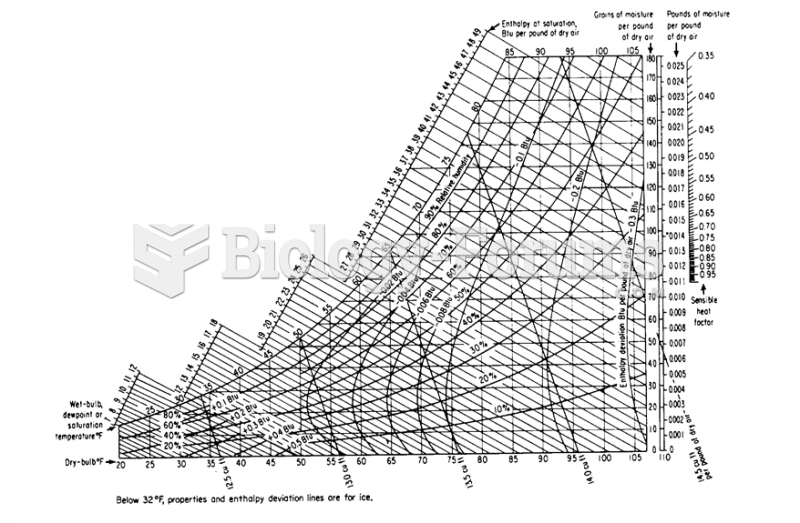 Humidity Chart