This topic contains a solution. Click here to go to the answer
|
|
|

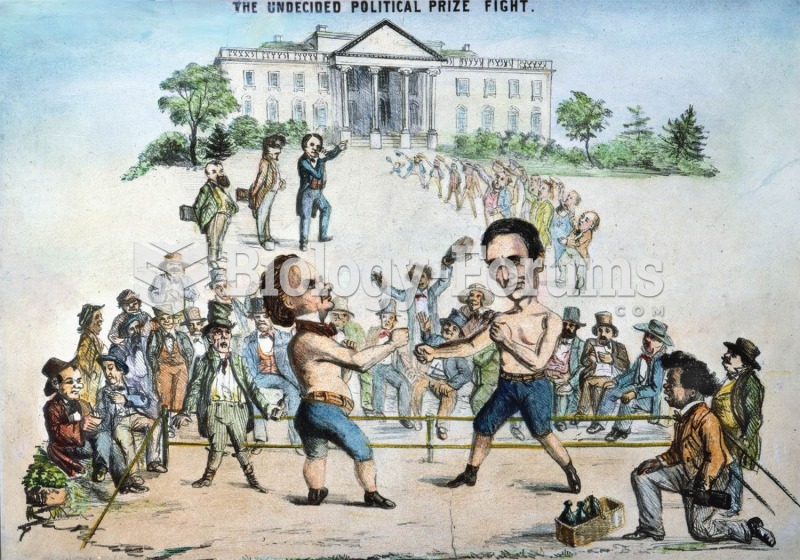 That politics was always a rough business is shown in this cartoon, which shows Lincoln, assisted by
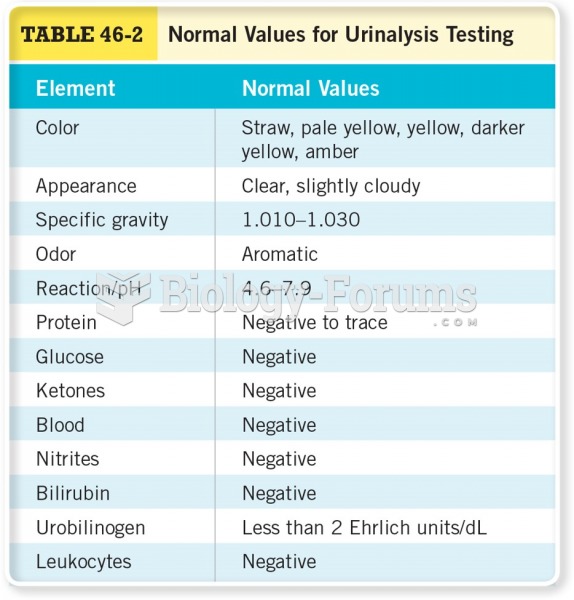 Normal Values for Urinalysis Testing
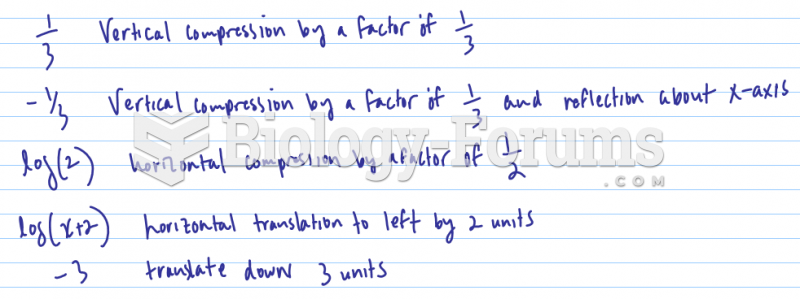 List transformations and Create a table of values for the following log function:
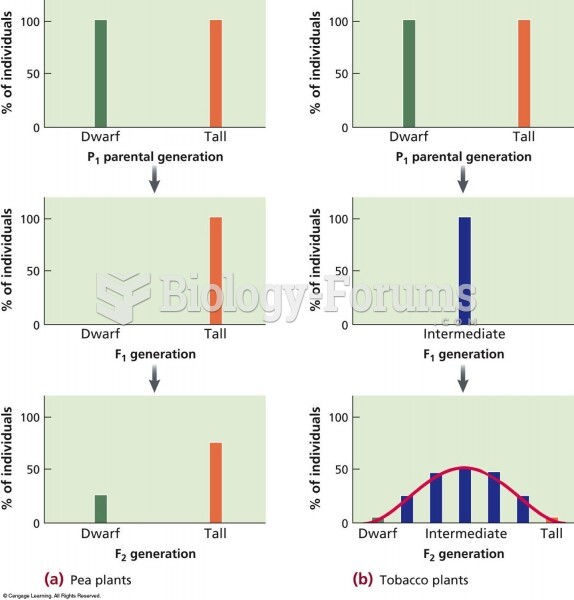 A comparison of a trait (height) that shows discontinuous and continuous phenotypes in different pla
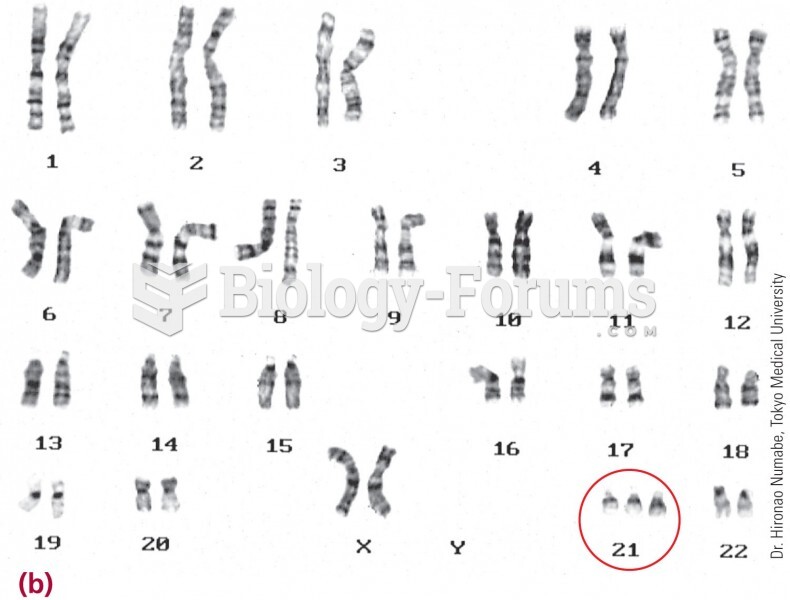 A karyotype shows this child has three copies of chromosome 21.
 Finding the graph of a Parabola using certain values