|
|
|

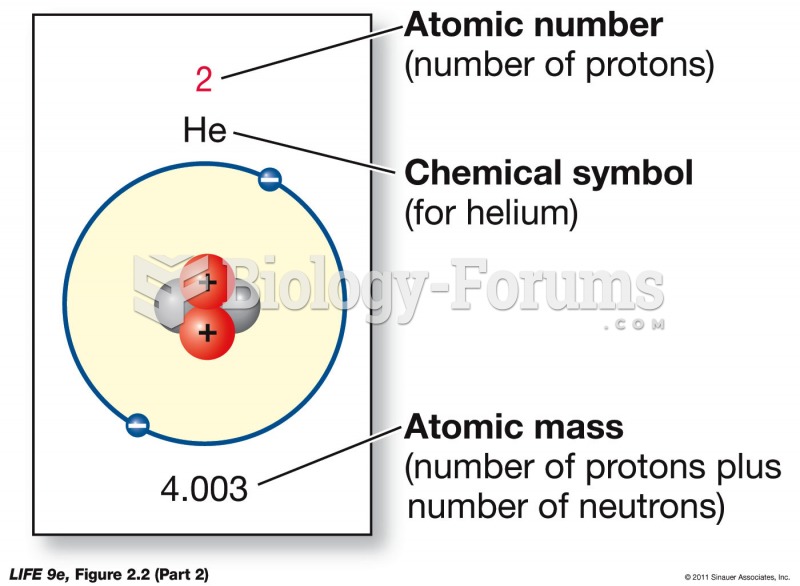 The Periodic Table (Part 2)
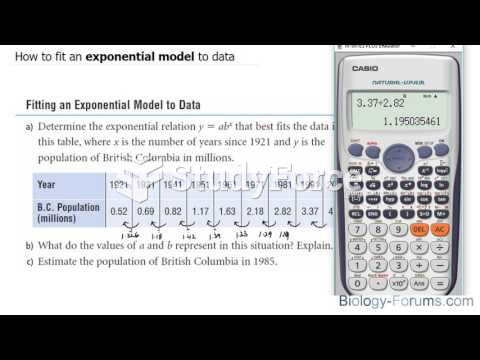 How to fit an exponential model to data
 How to create a table of values displaying commission and earnings (Question 1)
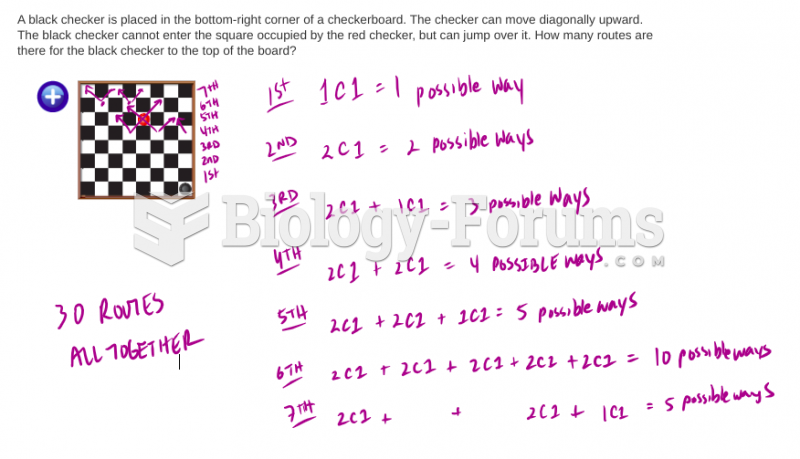 Data management questions
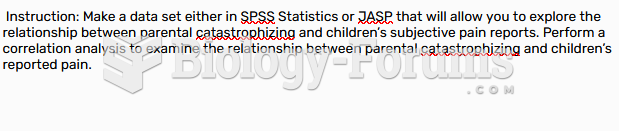 Table - Correlation Analysis
 Chi-Square Analysis of Mendel’s Trihybrid-Cross Data