This topic contains a solution. Click here to go to the answer
|
|
|

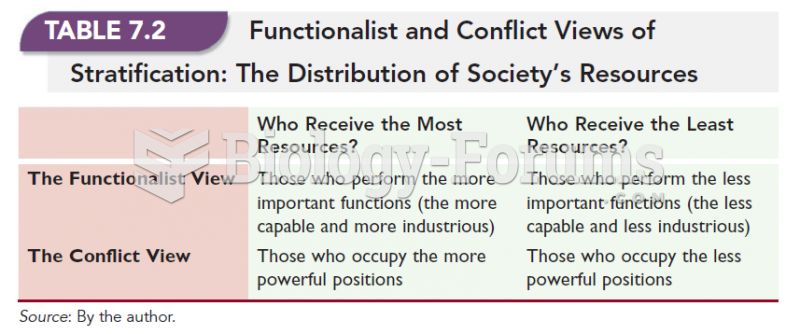 Functionalist and Conflict Views of Stratification: The Distribution of Society's Resources
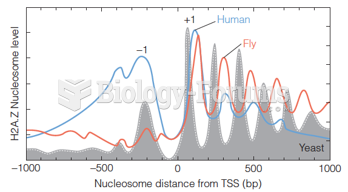 Distribution of H2A.Z-containing nucleosomes near a transcription start site (TSS)
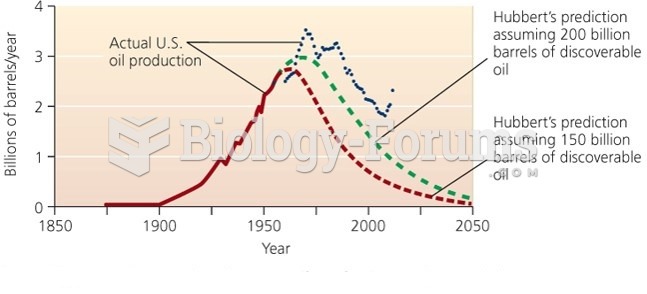 Hubbard’s Predication of Peak in U.S Oil Production with Actual Data
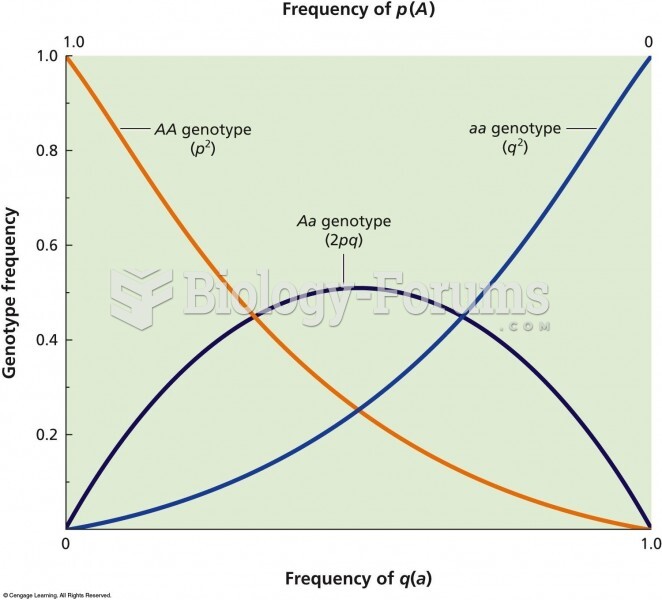 The relationship between allelic frequency and genotypic frequency in a population that is in Hardy-
 The effect of selection on allele frequency
 The frequency distribution of the allele in Southeast Asia and the Pacific Islands