This topic contains a solution. Click here to go to the answer
|
|
|

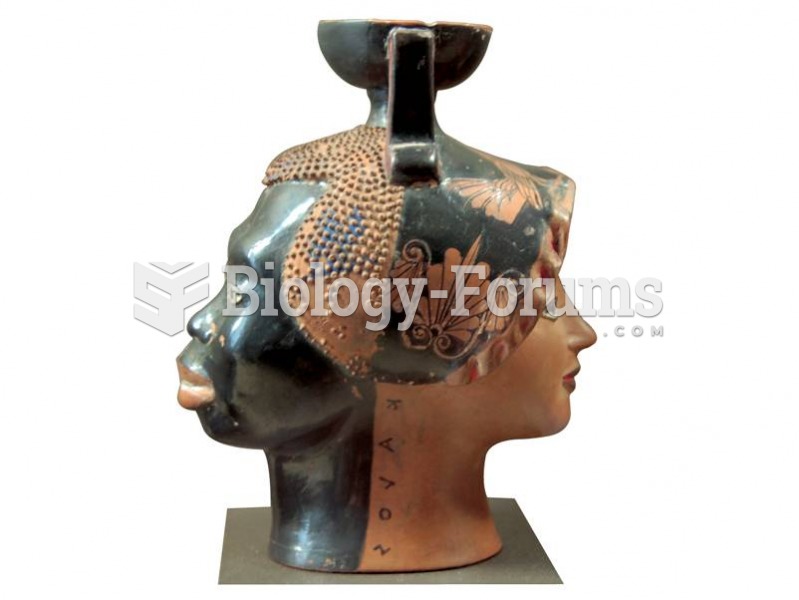 An aryballe vase or decanter made for carrying body oils clearly demonstrates that ancient Greeks we
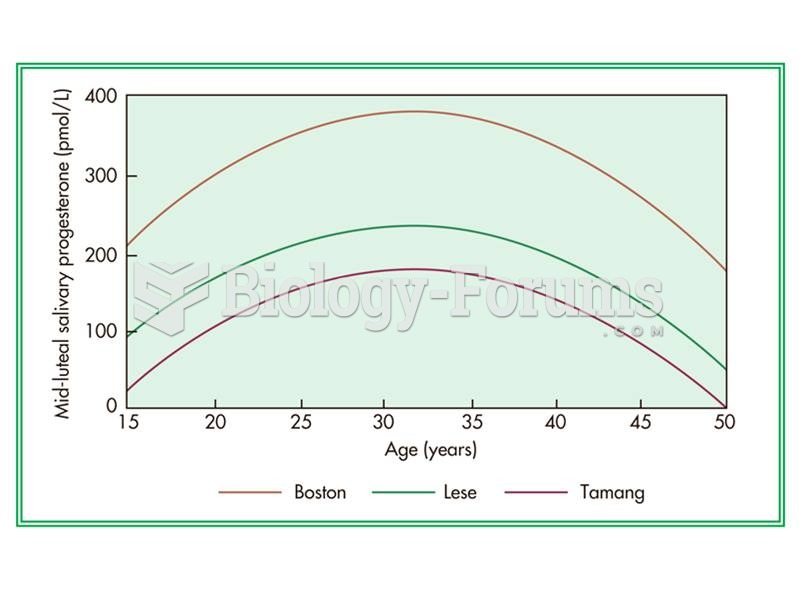 The age-dependent curve of salivary progresterone levels in three populations.
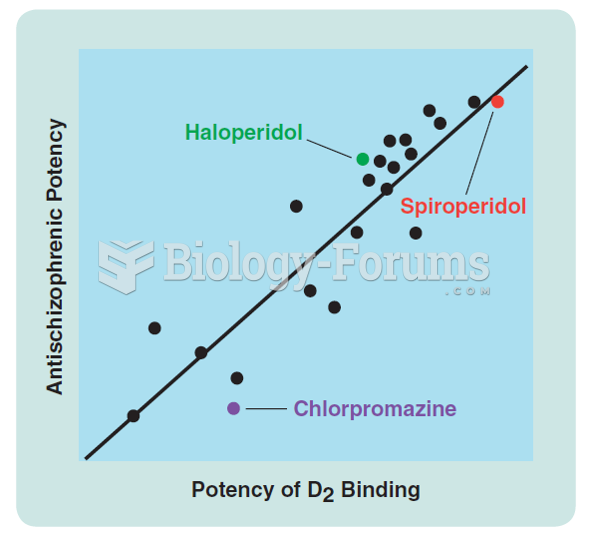 The positive correlation between the ability of various neuroleptics to bind to D2 receptors and ...
 How to solve a linear system when the variable is in the denominator position (Question 2 of 2)
 DNA sequence variation in parts of the Drosophila Adh gene
 Energy flow in the light-dependent reactions of photosynthesis