This topic contains a solution. Click here to go to the answer
|
|
|

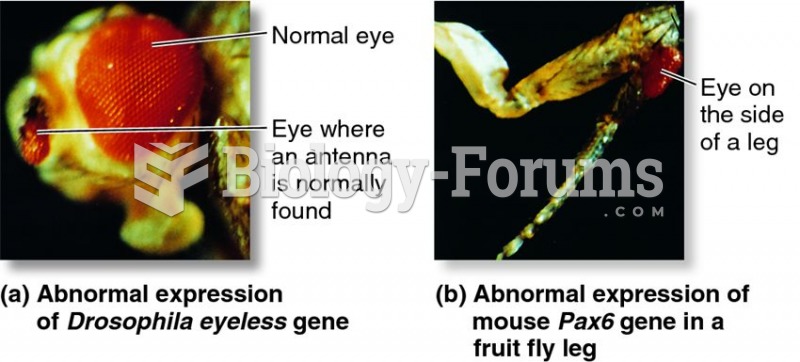 Formation of additional eyes in Drosophila caused by the abnormal expression of a master control gen
 The world has been horrified recently at a U.S. Congress so polarized and paralyzed that it cannot p
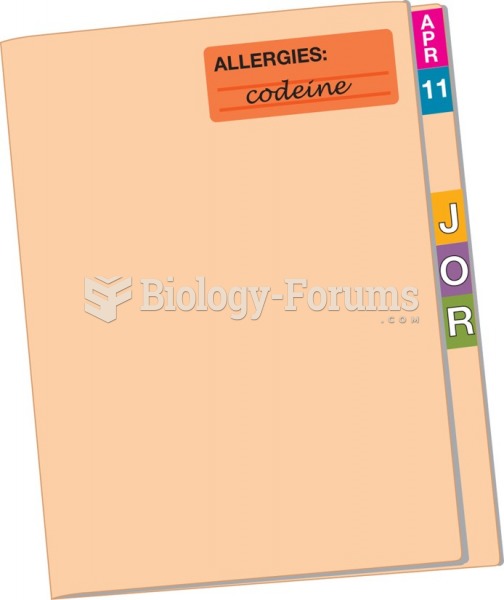 Using alert labels enables the medical staff to quickly identify important information such as ...
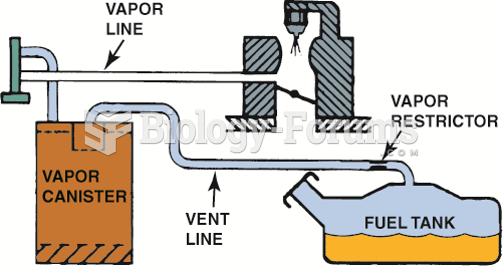 The evaporative emission control system includes all of the lines, hoses, and valves, plus the ...
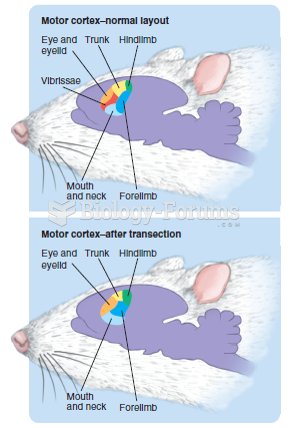 Reorganization of the rat motor cortex following transection of the motor neurons that control ...
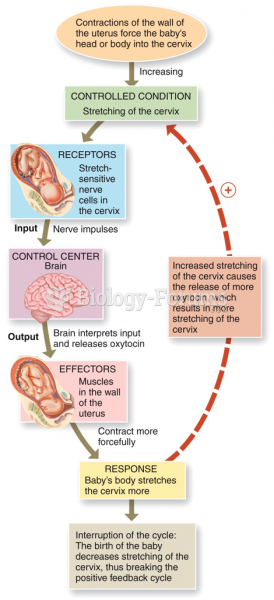 Control of Homeostasis: Positive Feedback