This topic contains a solution. Click here to go to the answer
|
|
|

 Plant
Plant
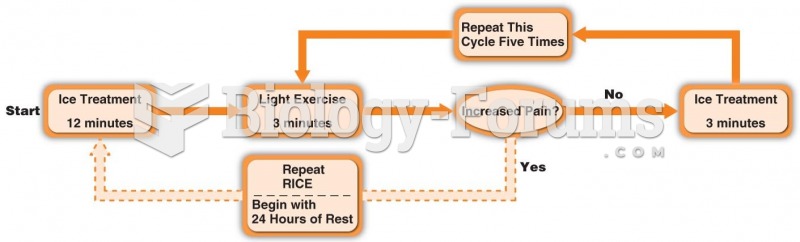 The Cryokinetic Process
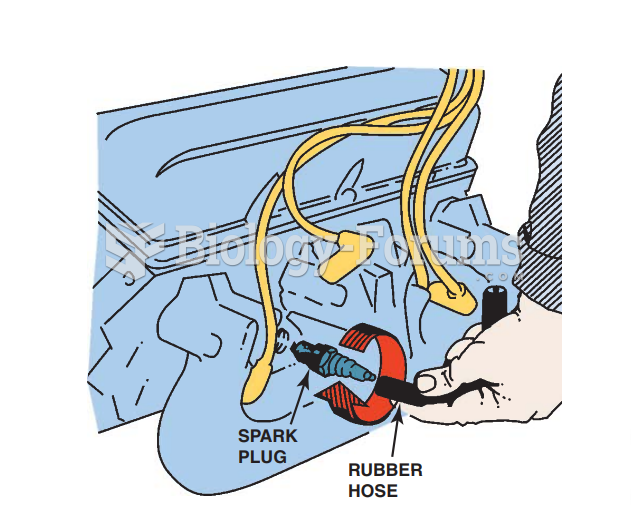 Compression Test: The Hose Trick
 The obturator test
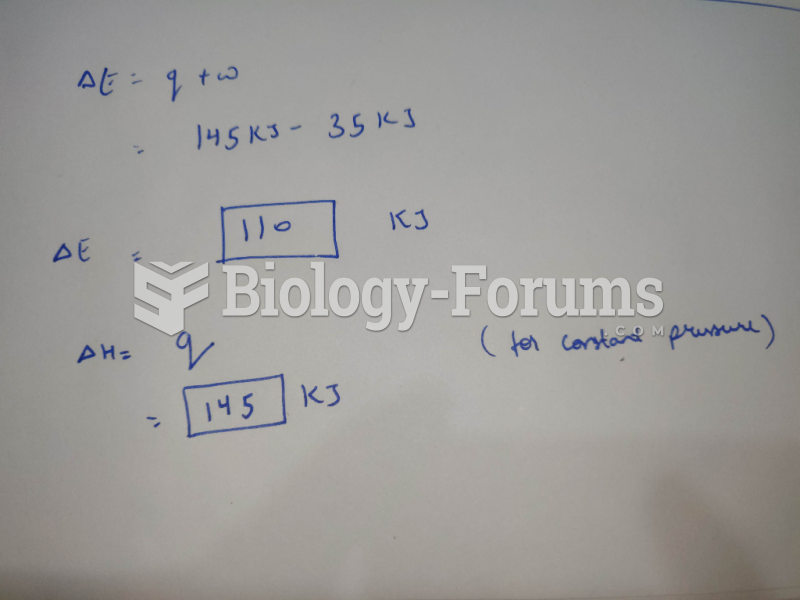 For a particular process that is carried out at constant pressure, q = 145 kJ and w = -35 kJ. ...
 Test-cross analysis of F1 plants