This topic contains a solution. Click here to go to the answer
|
|
|

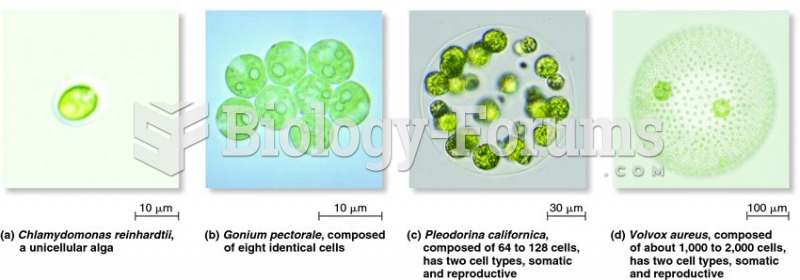 Variation in the level of multicellularity among volvocine algae
 Single-gene inheritance tracked at the DNA level
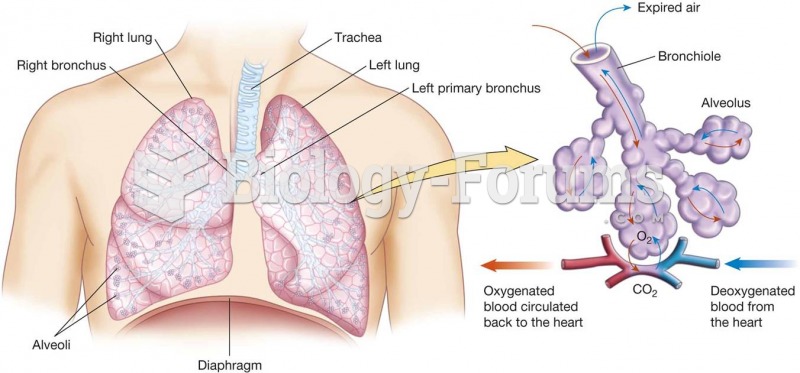 The lower respiratory tract
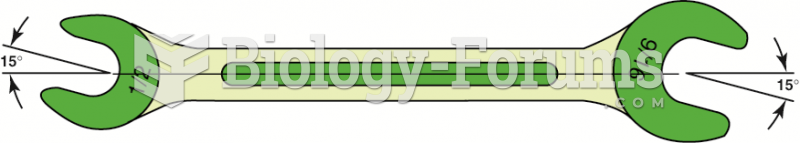 A typical open-end wrench. Note the size difference on each end and that the head is angled 15 ...
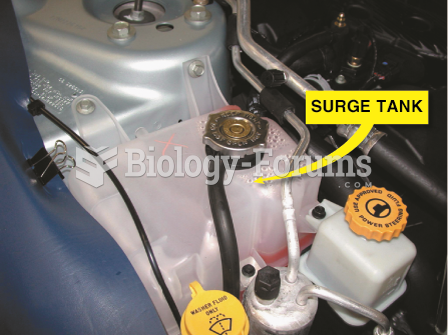 Some vehicles use a surge tank, which is located at the highest level of the cooling system, with ...
 Sample budget spreadsheet form for first year of business.