This topic contains a solution. Click here to go to the answer
|
|
|

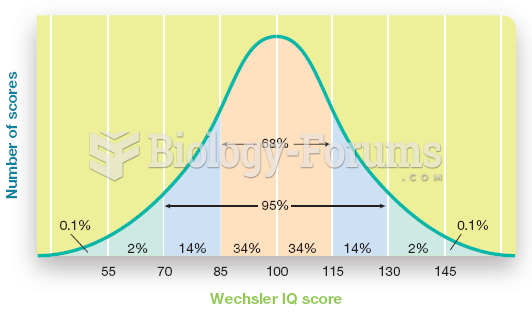 The Normal Distribution of Scores for a Standardized Intelligence Test
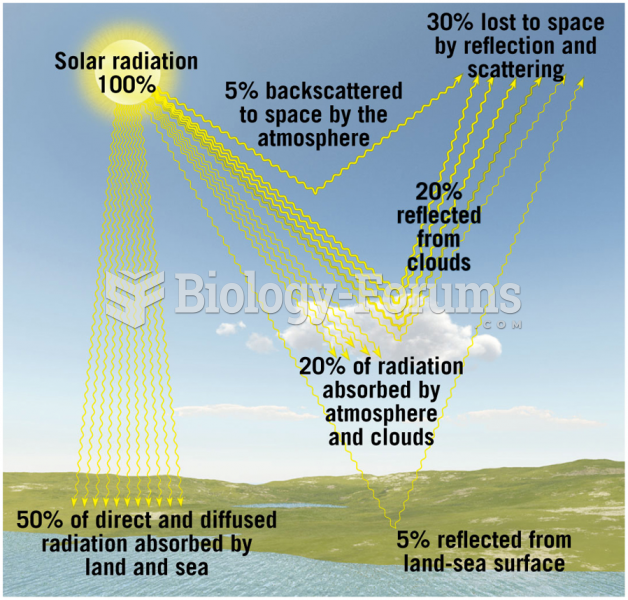 Average Distribution of Incoming Solar Radiation
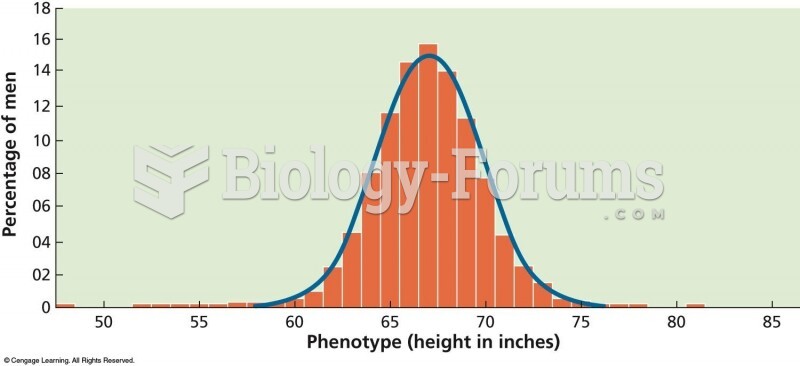 A bell-shaped, or “normal,” curve shows the distribution of phenotypes for traits controlled by ...
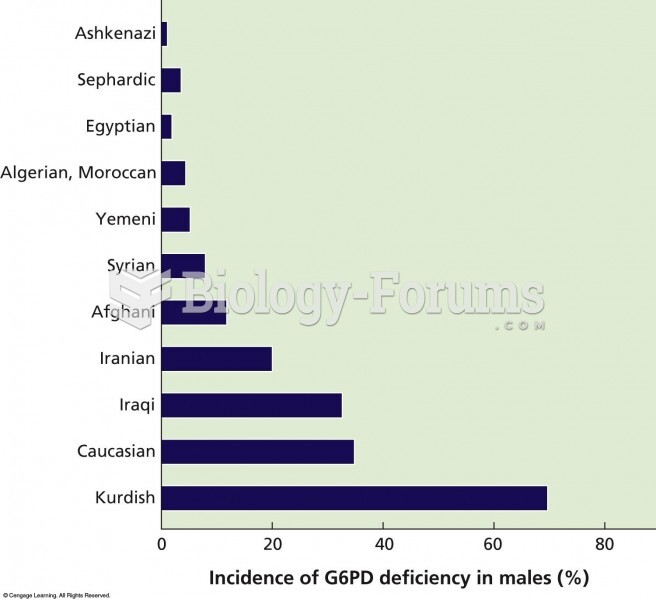 Distribution of glucose-6-phosphate dehydrogenase (G6PD) deficiency in various Jewish populations. B
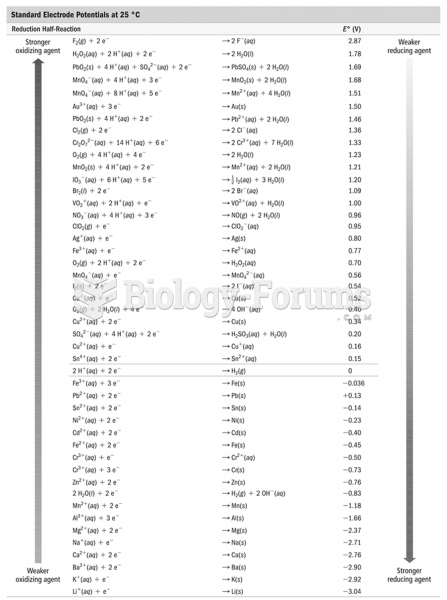 Standard Electrode Potentials at 25 Degrees
 The distribution of Neandertal and Denisovan DNA in the modern human genome