This topic contains a solution. Click here to go to the answer
|
|
|

 This young boy with muscular dystrophy needs to receive tube feedings and home nursing care. He atte
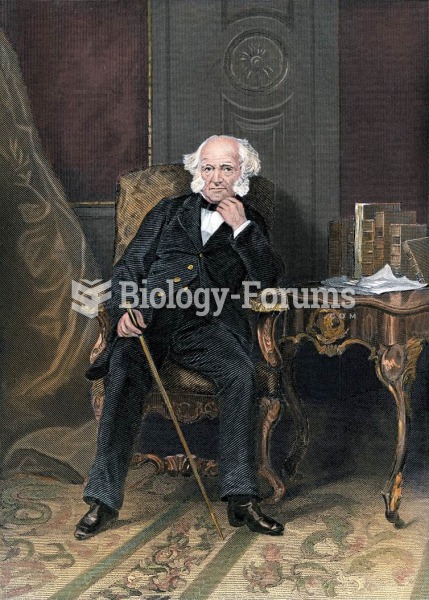 Martin Van Buren, sitting uncomfortably for this engraving, would eventually ascend to the presidenc
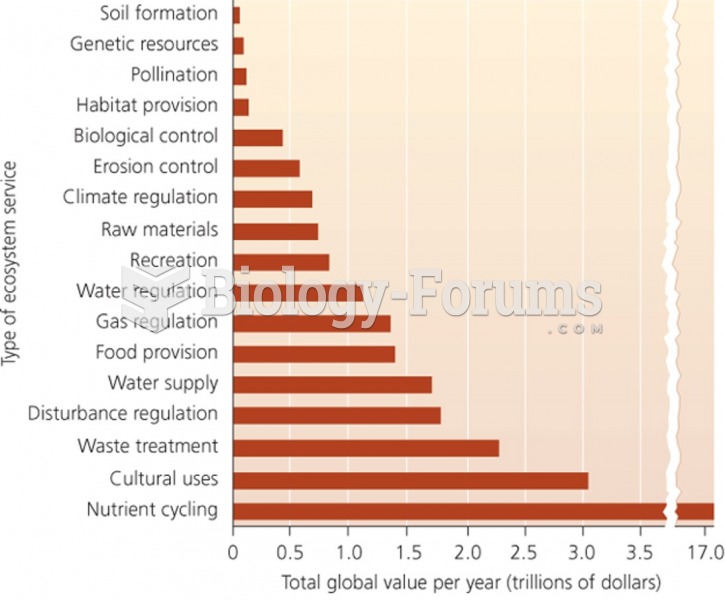 Types of ecosystem service vs. total global value per year
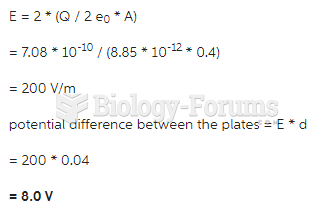
 State the equations
 A non-interest-bearing five-year note for $54600.00 issued May 1, 2015, is discounted April 1, ...
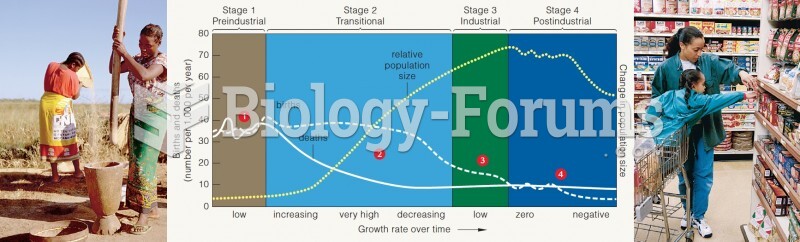 Demographic transition model for changes in population growth rates and sizes, correlated with long-