|
|
|

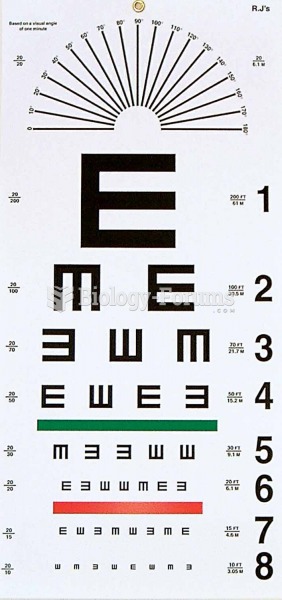 Snellen chart.
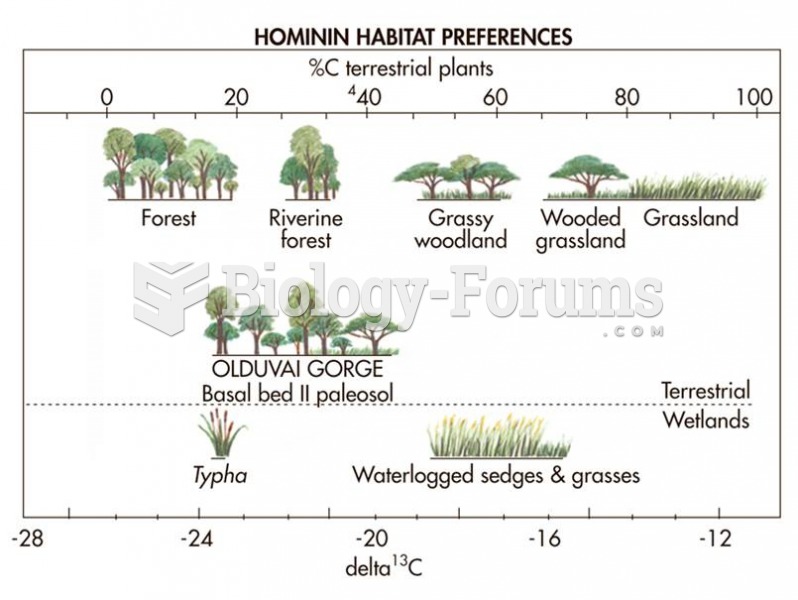 Habitat reconstruction is possible based on the kinds of plants present at past sites.
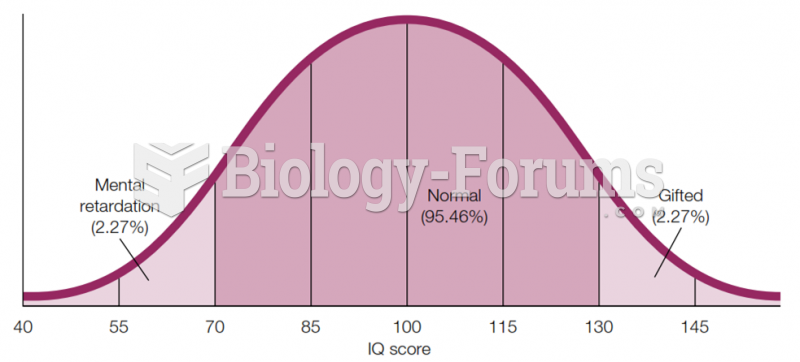 Bell Curve for Intelligence IQ scores for a population-based sample usually fall into this kind of
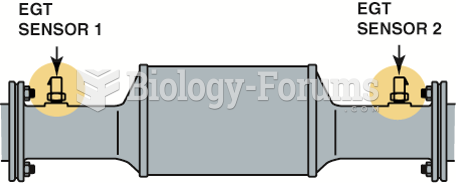 EGT 1 and EGT 2 are used by the PCM to help control after treatment.
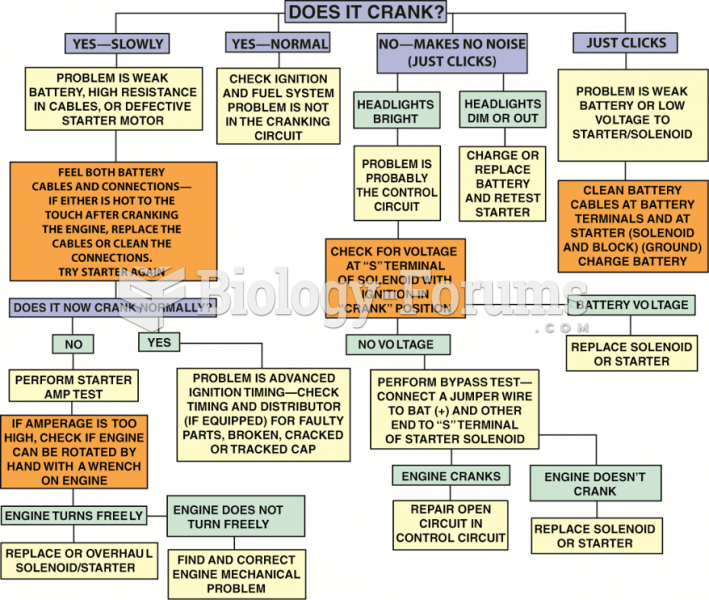 Starter diagnosis chart.
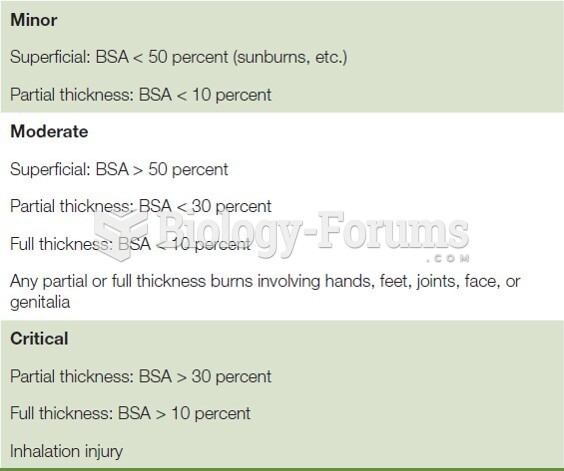 Burn Severity Chart