This topic contains a solution. Click here to go to the answer
|
|
|

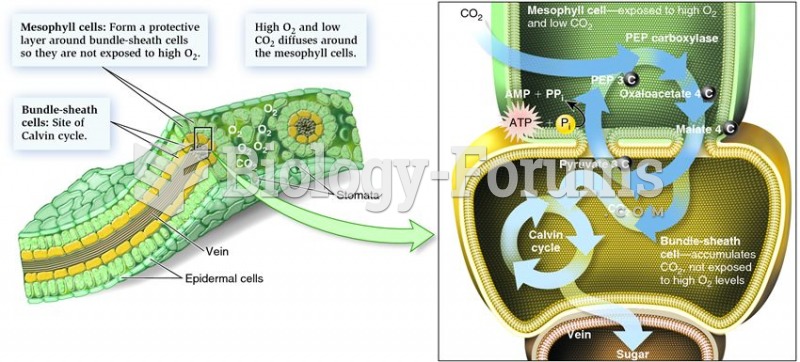 Leaf structure and its relationship to the C4 cycle
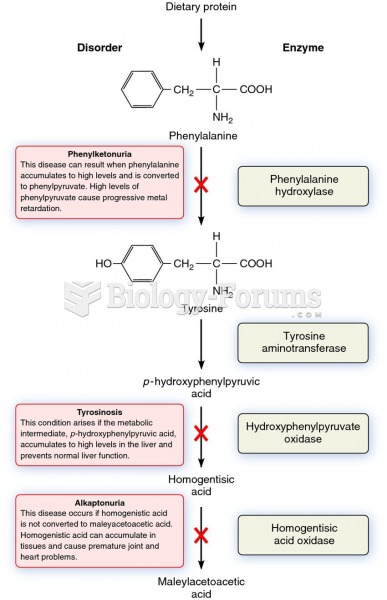 The metabolic pathway that breaks down phenylalanine and its relationship to certain genetic disease
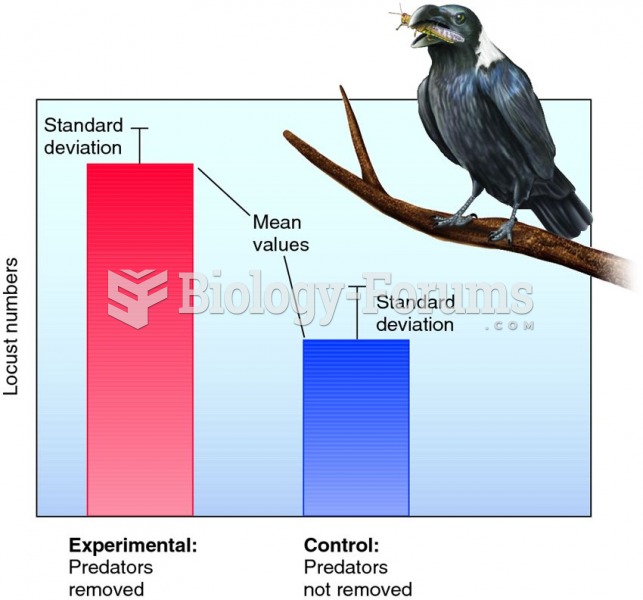 Graphic display of hypothetical results of a predator removal experiment.
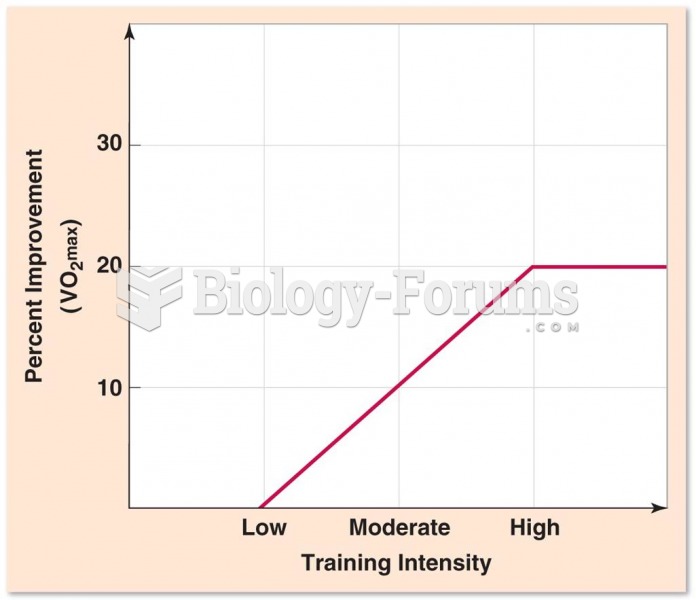 Relationship Between Training Intensity and VO2max Improvement
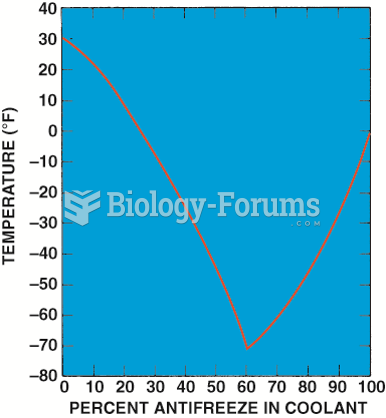 Graph showing the relationship between the freezing point of the coolant and the percentage of ...
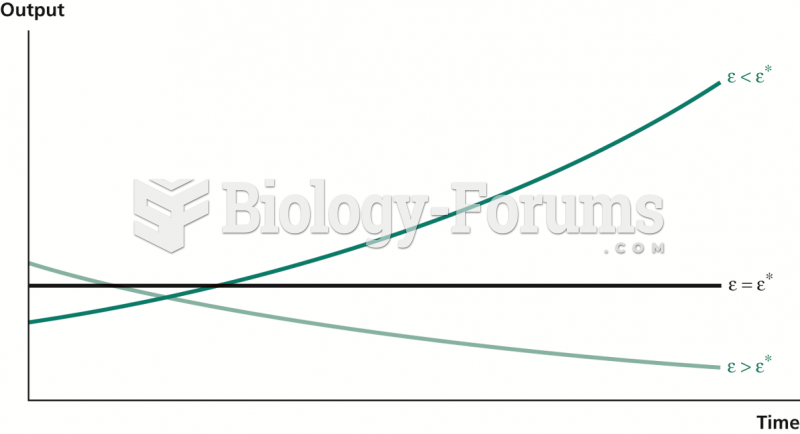 Relationship between Resource Use and Growth