This topic contains a solution. Click here to go to the answer
|
|
|

 China's proposed supercollider plans to be twice the size of the Large Hadron Co
 With a fortune of $66 billion, Bill Gates, a cofounder of Microsoft Corporation, is the second ...
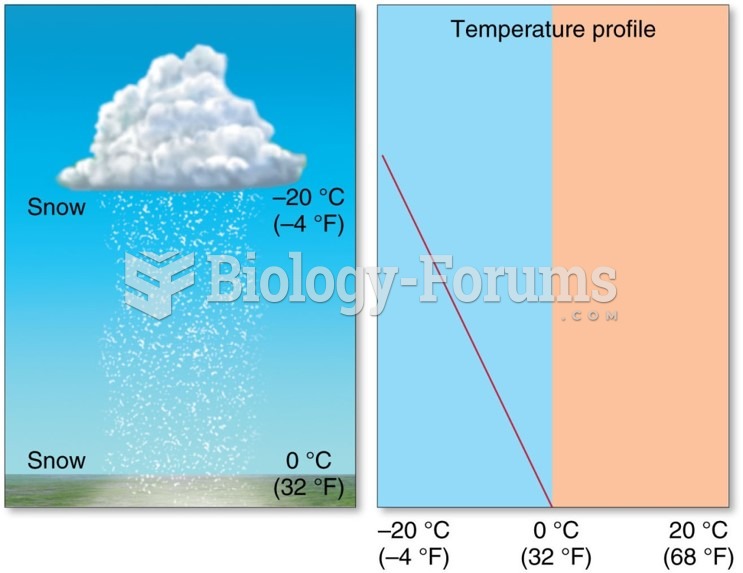 Distribution and Forms of Precipitation: Snow
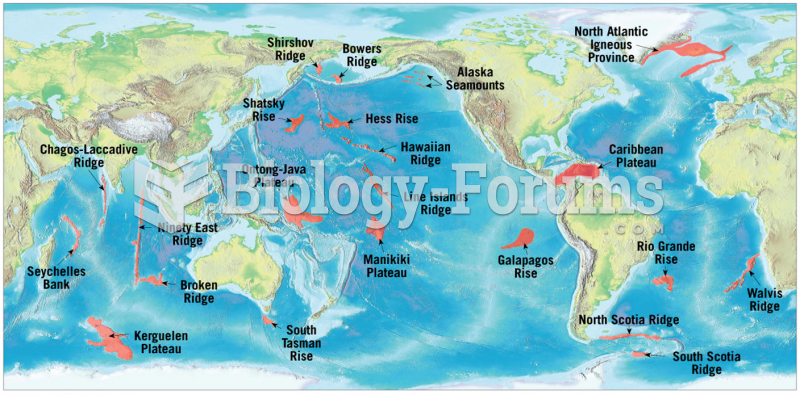 Distribution of Modern Day Oceanic Plateaus and Fragments
 The Distribution of Water on Earth
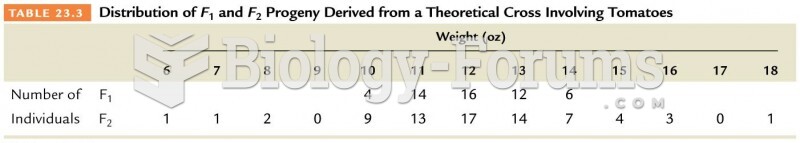 Distribution of F1 and F2 Progeny Derived from a Theoretical Cross Involving Tomatoes