This topic contains a solution. Click here to go to the answer
|
|
|

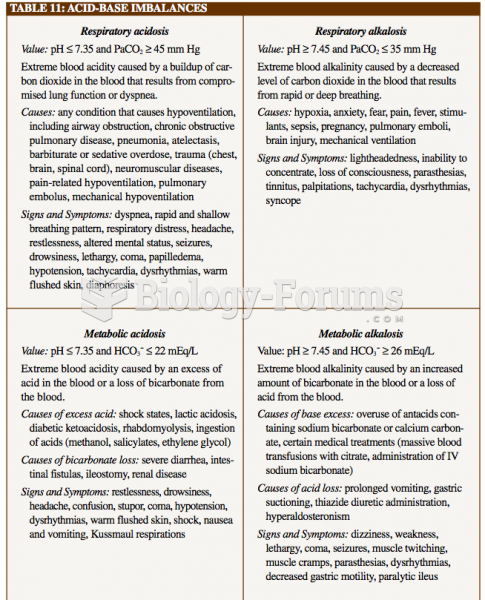 ABG chart
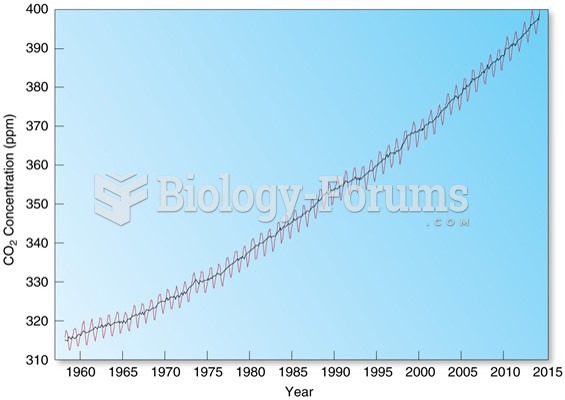 Variable Gases: Carbon Dioxide
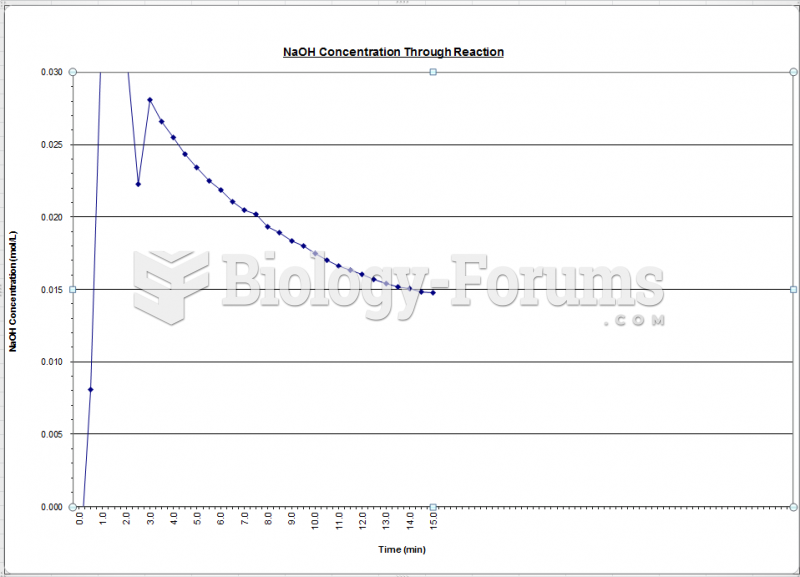 Fluidization - Concentration NaOH Chart
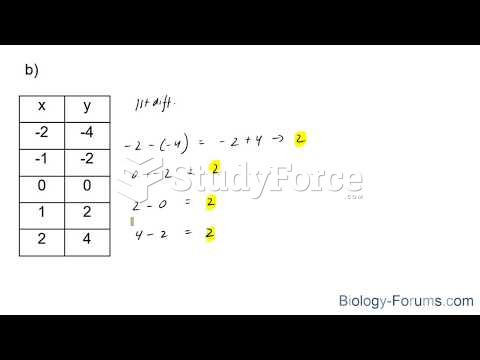 How to find the first and second differences for any table of values
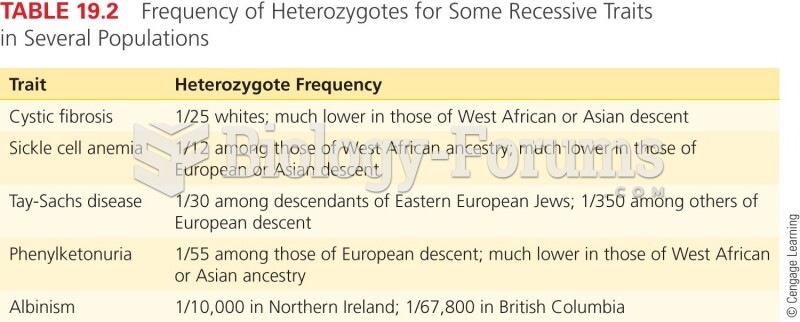 Frequency of Heterozygotes for Some Recessive Traits in Several Populations
 Separation of variable number tandem repeat (VNTR) alleles after PCR amplification